Neiman Marcus 2002 Annual Report Download - page 49
Download and view the complete annual report
Please find page 49 of the 2002 Neiman Marcus annual report below. You can navigate through the pages in the report by either clicking on the pages listed below, or by using the keyword search tool below to find specific information within the annual report.-
 1
1 -
2
-
3
-
4
-
5
-
6
-
7
-
8
-
9
-
10
-
11
-
12
-
13
-
14
-
15
-
16
-
17
-
18
-
19
-
20
-
21
-
22
-
23
-
24
-
25
-
26
-
27
-
28
-
29
-
30
-
31
-
32
-
33
-
34
-
35
-
36
-
37
-
38
-
 39
39 -
 40
40 -
 41
41 -
 42
42 -
 43
43 -
 44
44 -
 45
45 -
 46
46 -
 47
47 -
 48
48 -
 49
49 -
 50
50 -
 51
51 -
 52
52 -
 53
53 -
 54
54 -
 55
55 -
 56
56 -
 57
57 -
 58
58 -
 59
59 -
60
-
61
-
62
-
63
-
64
-
65
-
66
-
67
-
68
-
69
-
70
-
71
-
72
-
73
-
74
-
75
-
76
-
77
-
78
-
79
-
80
-
81
-
82
-
83
-
84
-
85
-
86
-
87
-
88
-
89
-
90
-
91
-
92
-
93
-
94
-
95
-
96
-
97
-
98
-
99
-
100
-
101
-
102
-
103
-
104
-
105
-
106
-
107
-
108
-
109
-
110
-
111
-
112
-
113
-
114
-
115
-
116
-
117
-
118
-
119
-
120
-
121
-
122
-
123
-
124
-
125
-
126
-
127
-
128
-
129
-
130
-
131
-
132
-
133
-
134
-
135
-
136
-
137
-
138
-
139
-
140
-
141
-
142
-
143
-
144
-
145
-
146
-
147
-
148
-
149
-
150
-
151
-
152
-
153
-
154
-
155
-
156
-
157
-
158
-
159
-
160
-
161
-
162
-
163
-
164
-
165
-
166
-
167
-
168
-
169
-
170
-
171
-
172
-
173
-
174
-
175
 |
 |
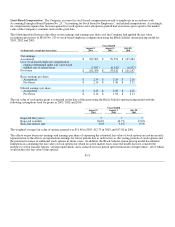
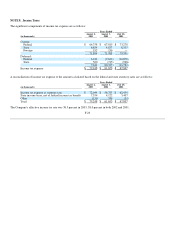
As a result, transfers to the Trust subsequent to December 2003 will be accounted for as secured borrowings. Based upon historical
information, the Company believes that the $225 million of receivables representing the Sold Interests and the $225 million obligation
for the Class A certificates will be brought back onto the Company's consolidated balance sheet over a four month period beginning in
December 2003 during which time the Company will incur an incremental loss of approximately $6 to $7 million.
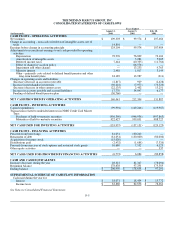
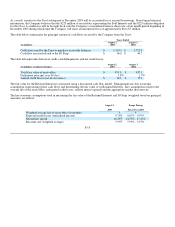
The table below summarizes the principal amount of cash flows received by the Company from the Trust:
Years Ended
(in millions)
August 2,
2003
August 3,
2002
Collections used by the Trust to purchase receivable balances $ 1,719.9 $ 1,721.0
Cash flow received related to the IO Strip $ 46.0 $ 44.7
The table belowprovides historical credit card delinquencies and net credit losses:
(in millions, except percentages)
August 2,
2003
August 3,
2002
Total face value of receivables $ 471.0 $ 437.1
Delinquent principal over 90 days 1.8%1.5%
Annual credit losses (net of recoveries) $ 14.3 $ 15.9
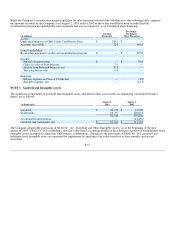
The fair value for the Retained Interests is estimated using a discounted cash flow model. Management uses key economic
assumptions in projecting future cash flows and determining the fair value of its Retained Interests. Key assumptions relate to the
average life of the receivables, anticipated credit losses, relative interest spreads and the appropriate market discount rate.
The key economic assumptions used in measuring the fair value of the Retained Interests and IO Strip (weighted based on principal
amounts) are follows:
August 2,
2003
Range During
Fiscal Year 2003
Weighted average life of receivables (in months) 4 4
Expected credit losses (annualized percent) 0.79%0.67% - 0.79%
Net interest spread 16.36%14.73% - 17.45%
Discount rate (weighted average) 5.95%5.95% - 5.97%
F-15