Neiman Marcus 2002 Annual Report Download - page 37
Download and view the complete annual report
Please find page 37 of the 2002 Neiman Marcus annual report below. You can navigate through the pages in the report by either clicking on the pages listed below, or by using the keyword search tool below to find specific information within the annual report.-
 1
1 -
2
-
3
-
4
-
5
-
6
-
7
-
8
-
9
-
10
-
11
-
12
-
13
-
14
-
15
-
16
-
17
-
18
-
19
-
20
-
21
-
22
-
23
-
24
-
25
-
26
-
 27
27 -
 28
28 -
 29
29 -
 30
30 -
 31
31 -
 32
32 -
 33
33 -
 34
34 -
 35
35 -
 36
36 -
 37
37 -
 38
38 -
 39
39 -
 40
40 -
 41
41 -
 42
42 -
 43
43 -
 44
44 -
 45
45 -
 46
46 -
 47
47 -
48
-
49
-
50
-
51
-
52
-
53
-
54
-
55
-
56
-
57
-
58
-
59
-
60
-
61
-
62
-
63
-
64
-
65
-
66
-
67
-
68
-
69
-
70
-
71
-
72
-
73
-
74
-
75
-
76
-
77
-
78
-
79
-
80
-
81
-
82
-
83
-
84
-
85
-
86
-
87
-
88
-
89
-
90
-
91
-
92
-
93
-
94
-
95
-
96
-
97
-
98
-
99
-
100
-
101
-
102
-
103
-
104
-
105
-
106
-
107
-
108
-
109
-
110
-
111
-
112
-
113
-
114
-
115
-
116
-
117
-
118
-
119
-
120
-
121
-
122
-
123
-
124
-
125
-
126
-
127
-
128
-
129
-
130
-
131
-
132
-
133
-
134
-
135
-
136
-
137
-
138
-
139
-
140
-
141
-
142
-
143
-
144
-
145
-
146
-
147
-
148
-
149
-
150
-
151
-
152
-
153
-
154
-
155
-
156
-
157
-
158
-
159
-
160
-
161
-
162
-
163
-
164
-
165
-
166
-
167
-
168
-
169
-
170
-
171
-
172
-
173
-
174
-
175
 |
 |

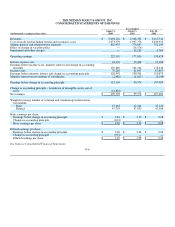
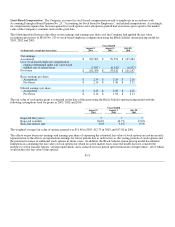
THE NEIMAN MARCUS GROUP, INC.
CONSOLIDATED BALANCE SHEETS
(in thousands, except shares)
August 2,
2003
August 3,
2002
ASSETS
CURRENT ASSETS
Cash and cash equivalents $ 206,950 $ 178,638
Undivided interests in NMG Credit Card Master Trust 243,145 208,602
Accounts receivable 22,595 19,778
Merchandise inventories 687,062 656,844
Deferred income taxes 17,586 17,746
Other current assets 68,783 46,018
TOTAL CURRENT ASSETS 1,246,121 1,127,626
PROPERTY AND EQUIPMENT
Land, buildings and improvements 598,471 558,330
Fixtures and equipment 631,393 507,289
Construction in progress 110,475 177,721
1,340,339 1,243,340
Less accumulated depreciation and amortization 666,154 590,174
PROPERTY AND EQUIPMENT, NET 674,185 653,166
OTHER ASSETS, NET 114,124 126,754
TOTAL ASSETS $ 2,034,430 $ 1,907,546
LIABILITIES AND SHAREHOLDERS' EQUITY
CURRENT LIABILITIES
Notes payable and current maturities of long-term liabilities $ 1,241 $ 1,098
Accounts payable 262,909 257,560
Accrued liabilities 266,259 259,800
TOTAL CURRENT LIABILITIES 530,409 518,458
LONG-TERM LIABILITIES
Notes and debentures 249,733 249,710
Other long-term liabilities 108,234 75,222
Deferred income taxes — 2,251
TOTAL LONG-TERM LIABILITIES 357,967 327,183
MINORITY INTEREST 8,206 6,592
COMMITMENTS AND CONTINGENCIES
COMMON STOCKS
Class A Common Stock - $.01 par value; Authorized – 100 million shares;
Issued 28,214,114 shares and 28,029,763 shares 282 280
Class B Common Stock - $.01 par value; Authorized – 100 million shares;
Issued 19,666,933 shares and 19,941,835 shares 197 200
ADDITIONAL PAID-IN CAPITAL 458,520 443,788
ACCUMULATED OTHER COMPREHENSIVE (LOSS) INCOME (25,573) 906
RETAINED EARNINGS 719,442 610,139
TREASURY STOCK (524,177 shares, at cost) (15,020)—
TOTAL SHAREHOLDERS' EQUITY 1,137,848 1,055,313
TOTAL LIABILITIES AND SHAREHOLDERS' EQUITY $ 2,034,430 $ 1,907,546
See Notes to Consolidated Financial Statements.
F-3