Neiman Marcus 2002 Annual Report Download - page 18
Download and view the complete annual report
Please find page 18 of the 2002 Neiman Marcus annual report below. You can navigate through the pages in the report by either clicking on the pages listed below, or by using the keyword search tool below to find specific information within the annual report.-
 1
1 -
2
-
3
-
4
-
5
-
6
-
7
-
 8
8 -
 9
9 -
 10
10 -
 11
11 -
 12
12 -
 13
13 -
 14
14 -
 15
15 -
 16
16 -
 17
17 -
 18
18 -
 19
19 -
 20
20 -
 21
21 -
 22
22 -
 23
23 -
 24
24 -
 25
25 -
 26
26 -
 27
27 -
 28
28 -
29
-
30
-
31
-
32
-
33
-
34
-
35
-
36
-
37
-
38
-
39
-
40
-
41
-
42
-
43
-
44
-
45
-
46
-
47
-
48
-
49
-
50
-
51
-
52
-
53
-
54
-
55
-
56
-
57
-
58
-
59
-
60
-
61
-
62
-
63
-
64
-
65
-
66
-
67
-
68
-
69
-
70
-
71
-
72
-
73
-
74
-
75
-
76
-
77
-
78
-
79
-
80
-
81
-
82
-
83
-
84
-
85
-
86
-
87
-
88
-
89
-
90
-
91
-
92
-
93
-
94
-
95
-
96
-
97
-
98
-
99
-
100
-
101
-
102
-
103
-
104
-
105
-
106
-
107
-
108
-
109
-
110
-
111
-
112
-
113
-
114
-
115
-
116
-
117
-
118
-
119
-
120
-
121
-
122
-
123
-
124
-
125
-
126
-
127
-
128
-
129
-
130
-
131
-
132
-
133
-
134
-
135
-
136
-
137
-
138
-
139
-
140
-
141
-
142
-
143
-
144
-
145
-
146
-
147
-
148
-
149
-
150
-
151
-
152
-
153
-
154
-
155
-
156
-
157
-
158
-
159
-
160
-
161
-
162
-
163
-
164
-
165
-
166
-
167
-
168
-
169
-
170
-
171
-
172
-
173
-
174
-
175
 |
 |

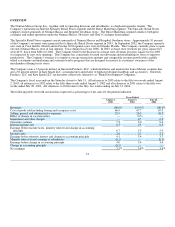
FISCAL YEAR 2003 COMPARED TO FISCAL YEAR 2002
Revenues. Revenues for 2003 of $3.10 billion increased $149.8 million, or 5.1 percent, from $2.95 billion in the prior year period.
The increase in revenues was primarily attributable to both an increase in comparable revenues and revenues generated by new stores.
Total revenues for 2002 included sales of approximately $36.6 million for the fifty-third week of 2002.
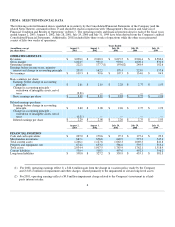
Comparable revenues in 2003 increased 3.8 percent for the fifty-two weeks ended August 2, 2003 compared to the fifty-two weeks
ended July 27, 2002. Comparable revenues increased 1.8 percent for Specialty Retail Stores and 12.5 percent for Direct Marketing for
the fifty-two weeks ended August 2, 2003 compared to the fifty-two weeks ended July 27, 2002. Changes in comparable revenues by
quarter (thirteen weeks 2003 compared to thirteen weeks 2002) for the Specialty Retail Stores and Direct Marketing segments are as
follows:
2003 2002
Fourth
Quarter
Third
Quarter
Second
Quarter
First
Quarter
Fourth
Quarter
Third
Quarter
Second
Quarter
First
Quarter
Specialty Retail Stores 6.4% (0.3)% (2.1)% 4.8% (3.1)% (2.6)% (3.3)% (12.1)%
Direct Marketing 15.8% 10.8% 11.7% 12.3% 0.7% 1.3% 1.2% (2.8)%
Total 8.5% 1.5% 0.5% 5.8% (2.8)% (1.9)% (3.0)% (10.9)%
For 2003, the increase in comparable revenues for Specialty Retail Stores was primarily due to increased sales for both Neiman
Marcus Stores and Bergdorf Goodman, particularly during the fourth quarter. The increase in comparable revenues for Direct
Marketing for 2003 was attributable to increased sales growth in the Neiman Marcus and Horchow brands, primarily the online
businesses, offset, in part, by a decrease in the Chef's Catalogue brand.
Comparable revenues for the Brand Development Companies increased in 2003, with an increase for both Gurwitch Products, LLC
and Kate Spade LLC.
In the first quarter of 2003, the Company opened two new Neiman Marcus stores in Coral Gables, Florida (September 2002) and
Orlando, Florida (October 2002). In the second quarter of 2003, the Company opened a new clearance store in the Denver, Colorado
area (November 2002) and completed a 71,000 square foot expansion and remodel of the Las Vegas Neiman Marcus store. In the
fourth quarter of 2003, the Company opened another new clearance center in Miami, Florida (May 2003). Sales derived from new
stores for 2003 were $79.6 million.
Gross margin. Gross margin was 33.1 percent of revenues in 2003 compared to 32.3 percent in the prior year period. The increase in
gross margin was primarily due to a decrease in markdowns.
Markdowns decreased as a percentage of revenues by 0.5 percent in 2003 compared to the prior year period. The Company incurred a
lower level of markdowns in the first and second quarters of 2003 compared to the prior year periods as higher markdowns were
required in the first and second quarters of 2002 in connection with additional and more aggressive promotional events necessary to
clear inventories in response to declines in retail sales in 2002. However, markdowns increased as a percentage of revenues for the
third quarter and fourth quarters of 2003 compared to the prior year period. Higher markdowns were necessary in both the third and
fourth quarters of 2003 to reduce a build-up of inventories in certain merchandise categories that occurred in the third quarter as a
result of lower than anticipated sales. The Company believes that sales in the third quarter of 2003, particularly the earlier weeks,
were negatively impacted by economic uncertainties due, in part, to the conflict in Iraq as well as adverse weather conditions in a
number of markets in which the Company operates.
Consistent with industry business practice, the Company receives allowances from certain of its vendors in support of the merchandise
purchased by the Company for resale. Certain allowances are received to reimburse the Company for markdowns taken and/or to
support the gross margins earned by the Company in connection with the sales of the vendor's merchandise. These allowances are
recognized as an increase to gross margin when the allowances are earned by the Company and approved by the vendor. Other
allowances received by the Company
14