Neiman Marcus 2002 Annual Report Download - page 20
Download and view the complete annual report
Please find page 20 of the 2002 Neiman Marcus annual report below. You can navigate through the pages in the report by either clicking on the pages listed below, or by using the keyword search tool below to find specific information within the annual report.
Fiscal year 2002 compared to Fiscal year 2001
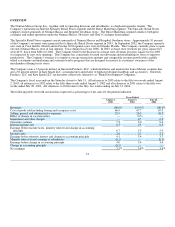
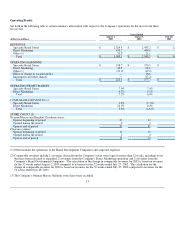
Revenues. Revenues for 2002 of $2.95 billion decreased $67.2 million, or 2.2 percent, from $3.02 billion in the prior year. Total
revenues for 2002 included sales of approximately $36.6 million for the fifty-third week of 2002.
The decrease in revenues in 2002 was primarily attributable to a 4.6 percent decrease in comparable revenues for the fifty-two weeks
ended July 27, 2002 compared to the fifty-two weeks ended July 28, 2001. The comparable sales decrease was offset, in part, by the
revenues from one new Neiman Marcus store in Tampa, Florida and one new clearance store in Atlanta, Georgia, each of which was
opened during the first quarter of 2002. In addition, the Company opened a new clearance store in Grapevine, Texas in April 2002.
Comparable revenues for the fifty-two weeks ended July 27, 2002 compared to the fifty-two weeks ended July 28, 2001 decreased 5.3
percent for Specialty Retail Stores, offset, in part by an increase of 0.2 percent for Direct Marketing. The Company believes the
decline in comparable revenues for Specialty Retail Stores for the fifty-two weeks ended July 27, 2002 compared to the fifty-two
weeks ended July 28, 2001 was due, in part, to 1) the elimination of certain promotional events conducted in 2001 in order to lower
inventory levels, 2) general economic conditions, 3) the softening in the retail industry that began in 2001 and 4) a decrease in retail
spending after the events of September 11, 2001. The net increase in comparable revenues for Direct Marketing reflects an increase in
revenues from the Company's online operations offset, in part, by a decline in revenues from the Direct Marketing catalogue
operations. As to the Direct Marketing catalogue operations, the Company believes the decrease in its comparable revenues for the
fifty-two weeks ended July 27, 2002 compared to the fifty-two weeks ended July 28, 2001 was impacted by 1) the planned reduction
in circulation schedules, 2) the elimination of certain catalogues, 3) general economic conditions and 4) a decrease in retail spending
after the events of September 11, 2001. Comparable revenues for the Brand Development companies declined in 2002 with a decrease
for Kate Spade LLC being offset, in part, by an increase for Gurwitch Products, LLC.
Gross margin. Gross margin was 32.3 percent of revenues for 2002 compared to 33.0 percent for 2001. The decline in gross margin
was primarily due to increases, as a percentage of revenues, in buying and occupancy costs and markdowns offset, in part, by
favorable inventory count results in the fourth quarter of 2002.
A significant portion of the Company's buying and occupancy costs are fixed in nature. As a result, buying and occupancy costs
increased as a percentage of revenues for 2002 compared to 2001 as a result of the decline in revenues. Additionally, buying and
occupancy costs as a percentage of revenues were higher for new stores than for mature stores.
Markdowns increased, as a percentage of revenues, by approximately 0.1 percent in 2002 compared to 2001. The Company incurred a
higher level of markdowns in the first and second quarters of 2002 than in the corresponding periods in the prior year in connection
with additional and more aggressive promotional events. These 2002 events were necessary to clear inventories in response to
declines in retail sales. However, markdowns were lower in the third quarter and fourth quarter of 2002 than in the same periods in
2001. In the third and fourth quarters of 2002, the Company was able to eliminate certain markdowns taken in connection with
promotional events that were held in the prior year to lower inventory levels in response to the lower-than-anticipated sales levels
achieved in the third and fourth quarters of 2001.
Consistent with industry business practice, the Company receives allowances from certain of its vendors in support of the merchandise
purchased by the Company for resale. Certain allowances are received to reimburse the Company for markdowns taken and/or to
support the gross margins earned by the Company in connection with the sales of the vendor's merchandise. These allowances are
recognized as an increase to gross margin when the allowances are earned by the Company and approved by the vendor. Other
allowances received by the Company represent reductions to the amounts paid by the Company to acquire the merchandise. These
allowances reduce the cost of the acquired merchandise and are recognized as an increase to gross margin at the time the goods are
sold. The amounts of vendor reimbursements received by the Company did not have a significant impact on the year-over-year
change in gross margin in 2002.
Selling, general and administrative expenses. Selling, general and administrative expenses (SG&A) were 26.3 percent of revenues in
2002 compared to 26.2 percent of revenues in 2001. The increase in SG&A as a percentage of revenues in the current year was
primarily due to 1) higher health care and various tax expenses, 2) a higher ratio
16


