Neiman Marcus 2002 Annual Report Download - page 38
Download and view the complete annual report
Please find page 38 of the 2002 Neiman Marcus annual report below. You can navigate through the pages in the report by either clicking on the pages listed below, or by using the keyword search tool below to find specific information within the annual report.-
 1
1 -
2
-
3
-
4
-
5
-
6
-
7
-
8
-
9
-
10
-
11
-
12
-
13
-
14
-
15
-
16
-
17
-
18
-
19
-
20
-
21
-
22
-
23
-
24
-
25
-
26
-
27
-
 28
28 -
 29
29 -
 30
30 -
 31
31 -
 32
32 -
 33
33 -
 34
34 -
 35
35 -
 36
36 -
 37
37 -
 38
38 -
 39
39 -
 40
40 -
 41
41 -
 42
42 -
 43
43 -
 44
44 -
 45
45 -
 46
46 -
 47
47 -
 48
48 -
49
-
50
-
51
-
52
-
53
-
54
-
55
-
56
-
57
-
58
-
59
-
60
-
61
-
62
-
63
-
64
-
65
-
66
-
67
-
68
-
69
-
70
-
71
-
72
-
73
-
74
-
75
-
76
-
77
-
78
-
79
-
80
-
81
-
82
-
83
-
84
-
85
-
86
-
87
-
88
-
89
-
90
-
91
-
92
-
93
-
94
-
95
-
96
-
97
-
98
-
99
-
100
-
101
-
102
-
103
-
104
-
105
-
106
-
107
-
108
-
109
-
110
-
111
-
112
-
113
-
114
-
115
-
116
-
117
-
118
-
119
-
120
-
121
-
122
-
123
-
124
-
125
-
126
-
127
-
128
-
129
-
130
-
131
-
132
-
133
-
134
-
135
-
136
-
137
-
138
-
139
-
140
-
141
-
142
-
143
-
144
-
145
-
146
-
147
-
148
-
149
-
150
-
151
-
152
-
153
-
154
-
155
-
156
-
157
-
158
-
159
-
160
-
161
-
162
-
163
-
164
-
165
-
166
-
167
-
168
-
169
-
170
-
171
-
172
-
173
-
174
-
175
 |
 |

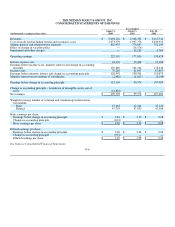
THE NEIMAN MARCUS GROUP, INC.
CONSOLIDATED STATEMENTS OF EARNINGS
Years Ended
(in thousands, except per share data)
August 2,
2003
August 3,
2002
July 28,
2001
Revenues $ 3,098,124 $ 2,948,332 $ 3,015,534
Cost of goods sold including buying and occupancy costs 2,073,579 1,997,378 2,020,954
Selling, general and administrative expenses 802,435 776,647 791,189
Effect of change in vacation policy — (16,576) —
Impairment and other charges — 13,233 9,763
Operating earnings 222,110 177,650 193,628
Interest expense, net 16,270 15,406 15,188
Earnings before income taxes, minority interest and change in accounting
principle 205,840 162,244 178,440
Income taxes 79,248 61,653 67,807
Earnings before minority interest and change in accounting principle 126,592 100,591 110,633
Minority interest in net earnings of subsidiaries (2,488)(1,017)(3,149)
Earnings before change in accounting principle 124,104 99,574 107,484
Change in accounting principle – writedown of intangible assets, net of
taxes (14,801)— —
Net earnings $ 109,303 $ 99,574 $ 107,484
Weighted average number of common and common equivalent shares
outstanding:
Basic 47,462 47,444 47,120
Diluted 47,795 47,835 47,586
Basic earnings per share:
Earnings before change in accounting principle $ 2.61 $ 2.10 $ 2.28
Change in accounting principle (0.31)— —
Basic earnings per share $ 2.30 $ 2.10 $ 2.28
Diluted earnings per share:
Earnings before change in accounting principle $ 2.60 $ 2.08 $ 2.26
Change in accounting principle (0.31)— —
Diluted earnings per share $ 2.29 $ 2.08 $ 2.26
See Notes to Consolidated Financial Statements.
F-4