Neiman Marcus 2002 Annual Report Download - page 16
Download and view the complete annual report
Please find page 16 of the 2002 Neiman Marcus annual report below. You can navigate through the pages in the report by either clicking on the pages listed below, or by using the keyword search tool below to find specific information within the annual report.-
 1
1 -
2
-
3
-
4
-
5
-
 6
6 -
 7
7 -
 8
8 -
 9
9 -
 10
10 -
 11
11 -
 12
12 -
 13
13 -
 14
14 -
 15
15 -
 16
16 -
 17
17 -
 18
18 -
 19
19 -
 20
20 -
 21
21 -
 22
22 -
 23
23 -
 24
24 -
 25
25 -
 26
26 -
27
-
28
-
29
-
30
-
31
-
32
-
33
-
34
-
35
-
36
-
37
-
38
-
39
-
40
-
41
-
42
-
43
-
44
-
45
-
46
-
47
-
48
-
49
-
50
-
51
-
52
-
53
-
54
-
55
-
56
-
57
-
58
-
59
-
60
-
61
-
62
-
63
-
64
-
65
-
66
-
67
-
68
-
69
-
70
-
71
-
72
-
73
-
74
-
75
-
76
-
77
-
78
-
79
-
80
-
81
-
82
-
83
-
84
-
85
-
86
-
87
-
88
-
89
-
90
-
91
-
92
-
93
-
94
-
95
-
96
-
97
-
98
-
99
-
100
-
101
-
102
-
103
-
104
-
105
-
106
-
107
-
108
-
109
-
110
-
111
-
112
-
113
-
114
-
115
-
116
-
117
-
118
-
119
-
120
-
121
-
122
-
123
-
124
-
125
-
126
-
127
-
128
-
129
-
130
-
131
-
132
-
133
-
134
-
135
-
136
-
137
-
138
-
139
-
140
-
141
-
142
-
143
-
144
-
145
-
146
-
147
-
148
-
149
-
150
-
151
-
152
-
153
-
154
-
155
-
156
-
157
-
158
-
159
-
160
-
161
-
162
-
163
-
164
-
165
-
166
-
167
-
168
-
169
-
170
-
171
-
172
-
173
-
174
-
175
 |
 |
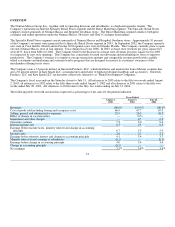
OVERVIEW
The Neiman Marcus Group, Inc., together with its operating divisions and subsidiaries, is a high-end specialty retailer. The
Company's operations include the Specialty Retail Stores segment and the Direct Marketing segment. The Specialty Retail Stores
segment consists primarily of Neiman Marcus and Bergdorf Goodman stores. The Direct Marketing segment conducts both print
catalogue and online operations under the Neiman Marcus, Horchow and Chef's Catalogue brand names.
The Specialty Retail Stores segment consists primarily of Neiman Marcus and Bergdorf Goodman stores. Approximately 81 percent
of the Company's revenues were generated by its Specialty Retail Stores segment in 2003. In September 2002, the Company opened a
new store in Coral Gables, Florida and in October 2002 opened a new store in Orlando, Florida. The Company currently plans to open
one new Neiman Marcus store in San Antonio, Texas during fiscal year 2006. In 2003, average store revenues per gross square foot
were $475, down from $481 for 2002. The Company believes the decrease in average store revenues per gross square foot in 2003
was impacted by new store openings. The Company has consistently focused on renovating and modernizing its stores to improve
productivity. The Company's strategy is to improve average transaction amounts and comparable revenue growth with carefully
edited assortments and marketing and customer loyalty programs that are designed to increase its customers' awareness of the
merchandise offerings in its stores.
The Company owns a 51 percent interest in Gurwitch Products, LLC, which distributes and markets the Laura Mercier cosmetic line,
and a 56 percent interest in Kate Spade LLC, a manufacturer and retailer of high-end designer handbags and accessories. Gurwitch
Products, LLC and Kate Spade LLC are hereafter collectively referred to as "Brand Development Companies."
The Company's fiscal year ends on the Saturday closest to July 31. All references to 2003 relate to the fifty-two weeks ended August
2, 2003; all references to 2002 relate to the fifty-three weeks ended August 3, 2002 and all references to 2001 relate to the fifty-two
weeks ended July 28, 2001. All references to 2004 relate to the fifty-two weeks ending on July 31, 2004.
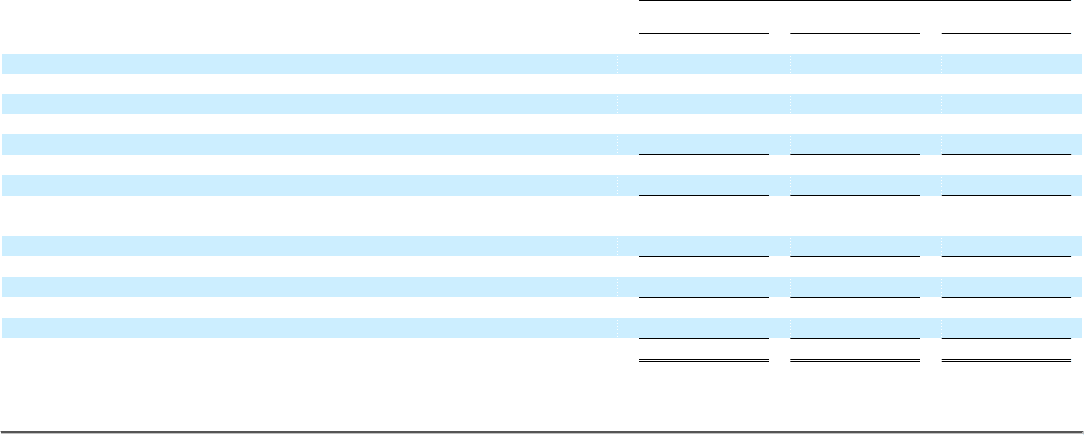
The following table sets forth certain items expressed as percentages of net sales for the periods indicated.
Years Ended
August 2,
2003
August 3,
2002
July 28,
2001
Revenues 100.0% 100.0% 100.0%
Cost of goods sold including buying and occupancy costs 66.9 67.7 67.0
Selling, general and administrative expenses 25.9 26.3 26.2
Effect of change in vacation policy — (0.5) —
Impairment and other charges — 0.5 0.4
Operating earnings 7.2 6.0 6.4
Interest expense, net 0.5 0.5 0.5
Earnings before income taxes, minority interest and change in accounting
principle 6.7 5.5 5.9
Income taxes 2.6 2.1 2.2
Earnings before minority interest and change in accounting principle 4.1 3.4 3.7
Minority interest in net earnings of subsidiaries (0.1)— (0.1)
Earnings before change in accounting principle 4.0 3.4 3.6
Change in accounting principle (0.5)— —
Net earnings 3.5%3.4%3.6%
12