Neiman Marcus 2002 Annual Report Download - page 39
Download and view the complete annual report
Please find page 39 of the 2002 Neiman Marcus annual report below. You can navigate through the pages in the report by either clicking on the pages listed below, or by using the keyword search tool below to find specific information within the annual report.-
 1
1 -
2
-
3
-
4
-
5
-
6
-
7
-
8
-
9
-
10
-
11
-
12
-
13
-
14
-
15
-
16
-
17
-
18
-
19
-
20
-
21
-
22
-
23
-
24
-
25
-
26
-
27
-
28
-
 29
29 -
 30
30 -
 31
31 -
 32
32 -
 33
33 -
 34
34 -
 35
35 -
 36
36 -
 37
37 -
 38
38 -
 39
39 -
 40
40 -
 41
41 -
 42
42 -
 43
43 -
 44
44 -
 45
45 -
 46
46 -
 47
47 -
 48
48 -
 49
49 -
50
-
51
-
52
-
53
-
54
-
55
-
56
-
57
-
58
-
59
-
60
-
61
-
62
-
63
-
64
-
65
-
66
-
67
-
68
-
69
-
70
-
71
-
72
-
73
-
74
-
75
-
76
-
77
-
78
-
79
-
80
-
81
-
82
-
83
-
84
-
85
-
86
-
87
-
88
-
89
-
90
-
91
-
92
-
93
-
94
-
95
-
96
-
97
-
98
-
99
-
100
-
101
-
102
-
103
-
104
-
105
-
106
-
107
-
108
-
109
-
110
-
111
-
112
-
113
-
114
-
115
-
116
-
117
-
118
-
119
-
120
-
121
-
122
-
123
-
124
-
125
-
126
-
127
-
128
-
129
-
130
-
131
-
132
-
133
-
134
-
135
-
136
-
137
-
138
-
139
-
140
-
141
-
142
-
143
-
144
-
145
-
146
-
147
-
148
-
149
-
150
-
151
-
152
-
153
-
154
-
155
-
156
-
157
-
158
-
159
-
160
-
161
-
162
-
163
-
164
-
165
-
166
-
167
-
168
-
169
-
170
-
171
-
172
-
173
-
174
-
175
 |
 |

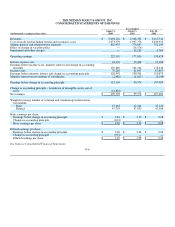
THE NEIMAN MARCUS GROUP, INC.
CONSOLIDATED STATEMENTS OF CASH FLOWS
Years Ended
(in thousands)
August 2,
2003
August 3,
2002
July 28,
2001
CASH FLOWS - OPERATING ACTIVITIES
Net earnings $ 109,303 $ 99,574 $ 107,484
Change in accounting – non-cash writedown of intangible assets, net of
taxes 14,801 — —
Earnings before change in accounting principle 124,104 99,574 107,484
Adjustments to reconcile net earnings to net cash provided by operating
activities:
Depreciation 78,976 76,809 73,104
Amortization of intangible assets — 5,284 5,905
Deferred income taxes 7,444 (10,335) (11,784)
Effect of change in vacation policy — (16,576) —
Impairment and other charges — 13,233 9,763
Minority interest 2,488 1,017 3,149
Other – primarily costs related to defined benefit pension and other
long-term benefit plans 24,189 13,987 (211)
Changes in operating assets and liabilities:
(Increase) decrease in accounts receivable (2,817) 929 (1,428)
Increase in merchandise inventories (30,218) (7,977) (73,523)
(Increase) decrease in other current assets (22,135) 2,402 13,251
Increase in accounts payable and accrued liabilities 17,770 34,047 6,177
Funding of defined benefit pension plan (30,760)— —
NET CASH PROVIDED BY OPERATING ACTIVITIES 169,041 212,394 131,887
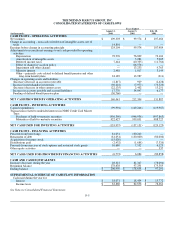
CASH FLOWS - INVESTING ACTIVITIES
Capital expenditures (99,994) (149,246) (119,987)
Transactions related to undivided interests in NMG Credit Card Master
Trust:
Purchases of held-to-maturity securities (956,390) (946,936) (997,863)
Maturities of held-to-maturity securities 922,427 959,051 988,727
NET CASH USED FOR INVESTING ACTIVITIES (133,957)(137,131)(129,123)
CASH FLOWS - FINANCING ACTIVITIES
Proceeds from borrowings 81,051 130,240 —
Repayment of debt (81,051) (130,000) (80,000)
Acquisition of treasury stock (15,020) — —
Distributions paid (2,432) (1,688) (7,320)
Proceeds from exercises of stock options and restricted stock grants 10,680 7,532 6,125
Other equity activities — — 337
NET CASH (USED FOR) PROVIDED BY FINANCING ACTIVITIES (6,772)6,084 (80,858)
CASH AND CASH EQUIVALENTS
Increase (decrease) during the year 28,312 81,347 (78,094)
Beginning balance 178,638 97,291 175,385
Ending balance $ 206,950 $ 178,638 $ 97,291
SUPPLEMENTAL SCHEDULE OF CASH FLOW INFORMATION
Cash paid during the year for:
Interest $ 18,071 $ 18,434 $ 15,772
Income taxes $ 61,860 $ 62,858 $ 76,462
See Notes to Consolidated Financial Statements.
F-5