Motorola 2006 Annual Report Download - page 93
Download and view the complete annual report
Please find page 93 of the 2006 Motorola annual report below. You can navigate through the pages in the report by either clicking on the pages listed below, or by using the keyword search tool below to find specific information within the annual report.-
 1
1 -
2
-
3
-
4
-
5
-
6
-
7
-
8
-
9
-
10
-
11
-
12
-
13
-
14
-
15
-
16
-
17
-
18
-
19
-
20
-
21
-
22
-
23
-
24
-
25
-
26
-
27
-
28
-
29
-
30
-
31
-
32
-
33
-
34
-
35
-
36
-
37
-
38
-
39
-
40
-
41
-
42
-
43
-
44
-
45
-
46
-
47
-
48
-
49
-
50
-
51
-
52
-
53
-
54
-
55
-
56
-
57
-
58
-
59
-
60
-
61
-
62
-
63
-
64
-
65
-
66
-
67
-
68
-
69
-
70
-
71
-
72
-
73
-
74
-
75
-
76
-
77
-
78
-
79
-
80
-
81
-
82
-
 83
83 -
 84
84 -
 85
85 -
 86
86 -
 87
87 -
 88
88 -
 89
89 -
 90
90 -
 91
91 -
 92
92 -
 93
93 -
 94
94 -
 95
95 -
 96
96 -
 97
97 -
 98
98 -
 99
99 -
 100
100 -
 101
101 -
 102
102 -
 103
103 -
104
-
105
-
106
-
107
-
108
-
109
-
110
-
111
-
112
-
113
-
114
-
115
-
116
-
117
-
118
-
119
-
120
-
121
-
122
-
123
-
124
-
125
-
126
-
127
-
128
-
129
-
130
-
131
-
132
-
133
-
134
-
135
-
136
-
137
-
138
-
139
-
140
-
141
-
142
-
143
-
144
 |
 |

85
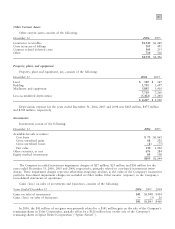
Other Current Assets
Other current assets consists of the following:
December 31
2006
2005
Contractor receivables $1,349 $1,240
Costs in excess of billings 505 495
Contract related deferred costs 369 255
Other 710 506
$2,933 $2,496
Property, plant, and equipment
Property, plant and equipment, net, consists of the following:
December 31
2006
2005
Land $ 129 $ 147
Building 1,705 1,697
Machinery and equipment 5,885 5,416
7,719 7,260
Less accumulated depreciation (5,452) (5,240)
$ 2,267 $ 2,020
Depreciation expense for the years ended December 31, 2006, 2005 and 2004 was $463 million, $473 million
and $502 million, respectively.
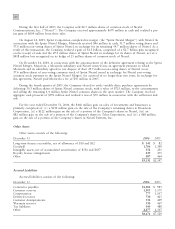
Investments
Investments consist of the following:
December 31
2006
2005
Available-for-sale securities:
Cost basis $70 $1,065
Gross unrealized gains 68 232
Gross unrealized losses (8) (75)
Fair value 130 1,222
Other securities, at cost 676 284
Equity method investments 89 138
$895 $1,644
The Company recorded investment impairment charges of $27 million, $25 million and $36 million for the
years ended December 31, 2006, 2005 and 2004, respectively, primarily related to cost-based investments write-
downs. These impairment charges represent other-than-temporary declines in the value of the Company's investment
portfolio. Investment impairment charges are included in Other within Other income (expense) in the Company's
consolidated statements of operations.
Gains (loss) on sales of investments and businesses, consists of the following:
Years Ended December 31
2006
2005 2004
Gains on sales of investments $41 $1,848 $434
Gains (loss) on sales of businesses Ì(3) 26
$41 $1,845 $460
In 2006, the $41 million of net gains was primarily related to a $141 million gain on the sale of the Company's
remaining shares in Telus Corporation, partially offset by a $126 million loss on the sale of the Company's
remaining shares in Sprint Nextel Corporation (""Sprint Nextel'').