Motorola 2006 Annual Report Download - page 42
Download and view the complete annual report
Please find page 42 of the 2006 Motorola annual report below. You can navigate through the pages in the report by either clicking on the pages listed below, or by using the keyword search tool below to find specific information within the annual report.-
 1
1 -
2
-
3
-
4
-
5
-
6
-
7
-
8
-
9
-
10
-
11
-
12
-
13
-
14
-
15
-
16
-
17
-
18
-
19
-
20
-
21
-
22
-
23
-
24
-
25
-
26
-
27
-
28
-
29
-
30
-
31
-
 32
32 -
 33
33 -
 34
34 -
 35
35 -
 36
36 -
 37
37 -
 38
38 -
 39
39 -
 40
40 -
 41
41 -
 42
42 -
 43
43 -
 44
44 -
 45
45 -
 46
46 -
 47
47 -
 48
48 -
 49
49 -
 50
50 -
 51
51 -
 52
52 -
53
-
54
-
55
-
56
-
57
-
58
-
59
-
60
-
61
-
62
-
63
-
64
-
65
-
66
-
67
-
68
-
69
-
70
-
71
-
72
-
73
-
74
-
75
-
76
-
77
-
78
-
79
-
80
-
81
-
82
-
83
-
84
-
85
-
86
-
87
-
88
-
89
-
90
-
91
-
92
-
93
-
94
-
95
-
96
-
97
-
98
-
99
-
100
-
101
-
102
-
103
-
104
-
105
-
106
-
107
-
108
-
109
-
110
-
111
-
112
-
113
-
114
-
115
-
116
-
117
-
118
-
119
-
120
-
121
-
122
-
123
-
124
-
125
-
126
-
127
-
128
-
129
-
130
-
131
-
132
-
133
-
134
-
135
-
136
-
137
-
138
-
139
-
140
-
141
-
142
-
143
-
144
 |
 |

34 MANAGEMENT'S DISCUSSION AND ANALYSIS
OF FINANCIAL CONDITION AND RESULTS OF OPERATIONS
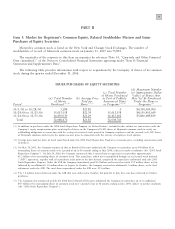
Item 7: Management's Discussion and Analysis of Financial Condition and Results of
Operations
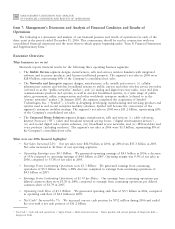
The following is a discussion and analysis of our financial position and results of operations for each of the
three years in the period ended December 31, 2006. This commentary should be read in conjunction with our
consolidated financial statements and the notes thereto which appear beginning under ""Item 8: Financial Statements
and Supplementary Data.''
Executive Overview
What businesses are we in?
Motorola reports financial results for the following three operating business segments:
‚ The Mobile Devices segment designs, manufactures, sells and services wireless handsets with integrated
software and accessory products, and licenses intellectual property. The segment's net sales in 2006 were
$28.4 billion, representing 66% of the Company's consolidated net sales.
‚ The Networks and Enterprise segment designs, manufactures, sells, installs and services: (i) cellular
infrastructure systems and wireless broadband systems to public carriers and other wireless service providers
(referred to as the ""public networks'' market), and (ii) analog and digital two-way radio, voice and data
communications products and systems, as well as wireless broadband systems, to a wide range of public
safety, government, utility, transportation and other worldwide enterprise markets (referred to as the
""private networks'' market). In January 2007, the segment completed the acquisition of Symbol
Technologies, Inc. (""Symbol''), a leader in designing, developing, manufacturing and servicing products and
systems used in end-to-end enterprise mobility solutions. Symbol will become the cornerstone of the
segment's enterprise mobility strategy. The segment's net sales in 2006 were $11.2 billion, representing 26%
of the Company's consolidated net sales.
‚ The Connected Home Solutions segment designs, manufactures, sells and services: (i) cable television,
Internet Protocol (""IP'') video and broadcast network set-top boxes (""digital entertainment devices''),
(ii) end-to-end digital video system solutions, (iii) broadband access networks, and (iv) IP-based data and
voice products (including modems). The segment's net sales in 2006 were $3.3 billion, representing 8% of
the Company's consolidated net sales.
What were our 2006 financial highlights?
‚Net Sales Increased 22%: Our net sales were $42.9 billion in 2006, up 22% from $35.3 billion in 2005.
Net sales increased in all three of our operating segments.
‚Operating Earnings were $4.1 Billion: We generated operating earnings of $4.1 billion in 2006, a decrease
of 11% compared to operating earnings of $4.6 billion in 2005. Operating margin was 9.5% of net sales in
2006, compared to 13.1% of net sales in 2005.
‚Earnings From Continuing Operations were $3.3 Billion: We generated earnings from continuing
operations of $3.3 billion in 2006, a 28% decrease compared to earnings from continuing operations of
$4.5 billion in 2005.
‚Earnings From Continuing Operations of $1.30 per Share: Our earnings from continuing operations per
diluted common share were $1.30 in 2006, compared to earnings from continuing operations per diluted
common share of $1.79 in 2005.
‚Operating Cash Flow of $3.5 Billion: We generated operating cash flow of $3.5 billion in 2006, compared
to operating cash flow of $4.3 billion in 2005.
‚Net Cash*Increased by 7%: We increased our net cash position by $712 million during 2006 and ended
the year with a net cash position of $11.2 billion.
* Net Cash • Cash and cash equivalents ° Sigma Funds ° Short-term investments ¿ Notes payable and current portion of long-term debtÌ
Long-term Debt