Motorola 2006 Annual Report Download - page 101
Download and view the complete annual report
Please find page 101 of the 2006 Motorola annual report below. You can navigate through the pages in the report by either clicking on the pages listed below, or by using the keyword search tool below to find specific information within the annual report.-
 1
1 -
2
-
3
-
4
-
5
-
6
-
7
-
8
-
9
-
10
-
11
-
12
-
13
-
14
-
15
-
16
-
17
-
18
-
19
-
20
-
21
-
22
-
23
-
24
-
25
-
26
-
27
-
28
-
29
-
30
-
31
-
32
-
33
-
34
-
35
-
36
-
37
-
38
-
39
-
40
-
41
-
42
-
43
-
44
-
45
-
46
-
47
-
48
-
49
-
50
-
51
-
52
-
53
-
54
-
55
-
56
-
57
-
58
-
59
-
60
-
61
-
62
-
63
-
64
-
65
-
66
-
67
-
68
-
69
-
70
-
71
-
72
-
73
-
74
-
75
-
76
-
77
-
78
-
79
-
80
-
81
-
82
-
83
-
84
-
85
-
86
-
87
-
88
-
89
-
90
-
 91
91 -
 92
92 -
 93
93 -
 94
94 -
 95
95 -
 96
96 -
 97
97 -
 98
98 -
 99
99 -
 100
100 -
 101
101 -
 102
102 -
 103
103 -
 104
104 -
 105
105 -
 106
106 -
 107
107 -
 108
108 -
 109
109 -
 110
110 -
 111
111 -
112
-
113
-
114
-
115
-
116
-
117
-
118
-
119
-
120
-
121
-
122
-
123
-
124
-
125
-
126
-
127
-
128
-
129
-
130
-
131
-
132
-
133
-
134
-
135
-
136
-
137
-
138
-
139
-
140
-
141
-
142
-
143
-
144
 |
 |

93
earnings that the Company intends to reinvest indefinitely, provisions have been made for the estimated U.S. federal
income taxes applicable to undistributed earnings of non-U.S. subsidiaries. Undistributed earnings that the Company
intends to reinvest indefinitely, and for which no U.S. Federal income taxes has been provided, aggregate
$4.0 billion, $2.8 billion and $5.6 billion at December 31, 2006, 2005 and 2004, respectively. The portion of
earnings not reinvested indefinitely may be distributed without additional U.S. federal income taxes charges given
the U.S. federal tax provisions accrued on undistributed earnings and the utilization of available foreign tax credits.
On October 22, 2004, the American Jobs Creation Act of 2004 (""the Act'') was signed into law. The Act
provides for a special one-time tax incentive for U.S. multinationals to repatriate accumulated earnings from their
foreign subsidiaries by providing an 85 percent dividends received deduction for certain qualifying dividends. The
Company repatriated approximately $4.6 billion of accumulated earnings under the Act and recorded an associated
tax benefit of $265 million in 2005. The Company finalized certain actions maximizing the tax benefit attributable
to the repatriation of foreign earnings under the provisions of the Act and recognized an additional $68 million of
net tax benefits relating to these actions during 2006.
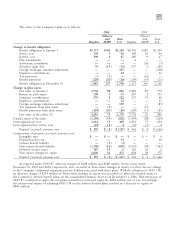
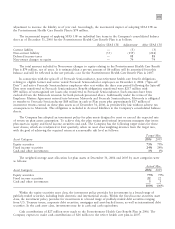
Differences between income tax expense (benefit) computed at the U.S. federal statutory tax rate of 35% and
income tax expense (benefit) are as follows:
Years Ended December 31
2006
2005 2004
Income tax expense at statutory rate $1,613 $2,244 $1,089
Taxes on non-U.S. earnings (449) (460) (528)
State income taxes 77 121 66
Tax benefit on qualifying repatriations (68) (265) Ì
Tax on undistributed non-U.S. earnings 194 202 327
Research credits (34) (23) (72)
Foreign export sales and section 199 deduction (22) (13) (30)
Non-deductible acquisition charges 4211
Goodwill impairments ÌÌ44
Tax benefit on disposition of subsidiaries Ì(81) Ì
Other provisions 247 233 42
Charitable contributions (28) ÌÌ
Valuation allowance (187) (88) (26)
Other 221 90
$1,349 $1,893 $1,013
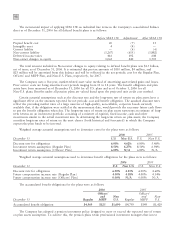
Significant components of deferred tax assets (liabilities) are as follows:
December 31
2006
2005
Inventory $ 163 $ 223
Employee benefits 915 881
Capitalized items 915 1,033
Tax basis differences on investments 110 (104)
Depreciation tax basis differences on fixed assets 89 63
Undistributed non-U.S. earnings (329) (229)
Tax carryforwards 1,515 2,098
Available for sale securities (23) (60)
Business reorganization 38 14
Long-term financing reserves 9152
Warranty and customer reserves 398 356
Deferred revenue 224 101
Valuation allowances (740) (896)
Deferred charges 46 45
Other (357) (146)
$2,973 $3,531
Gross deferred tax assets were $8.7 billion, $9.9 billion and $9.8 billion at December 31, 2006, 2005 and 2004,
respectively. Deferred tax assets, net of valuation allowances, were $8.0 billion, $9.0 billion and $8.9 billion at