Motorola 2006 Annual Report Download - page 58
Download and view the complete annual report
Please find page 58 of the 2006 Motorola annual report below. You can navigate through the pages in the report by either clicking on the pages listed below, or by using the keyword search tool below to find specific information within the annual report.-
 1
1 -
2
-
3
-
4
-
5
-
6
-
7
-
8
-
9
-
10
-
11
-
12
-
13
-
14
-
15
-
16
-
17
-
18
-
19
-
20
-
21
-
22
-
23
-
24
-
25
-
26
-
27
-
28
-
29
-
30
-
31
-
32
-
33
-
34
-
35
-
36
-
37
-
38
-
39
-
40
-
41
-
42
-
43
-
44
-
45
-
46
-
47
-
 48
48 -
 49
49 -
 50
50 -
 51
51 -
 52
52 -
 53
53 -
 54
54 -
 55
55 -
 56
56 -
 57
57 -
 58
58 -
 59
59 -
 60
60 -
 61
61 -
 62
62 -
 63
63 -
 64
64 -
 65
65 -
 66
66 -
 67
67 -
 68
68 -
69
-
70
-
71
-
72
-
73
-
74
-
75
-
76
-
77
-
78
-
79
-
80
-
81
-
82
-
83
-
84
-
85
-
86
-
87
-
88
-
89
-
90
-
91
-
92
-
93
-
94
-
95
-
96
-
97
-
98
-
99
-
100
-
101
-
102
-
103
-
104
-
105
-
106
-
107
-
108
-
109
-
110
-
111
-
112
-
113
-
114
-
115
-
116
-
117
-
118
-
119
-
120
-
121
-
122
-
123
-
124
-
125
-
126
-
127
-
128
-
129
-
130
-
131
-
132
-
133
-
134
-
135
-
136
-
137
-
138
-
139
-
140
-
141
-
142
-
143
-
144
 |
 |

50 MANAGEMENT'S DISCUSSION AND ANALYSIS
OF FINANCIAL CONDITION AND RESULTS OF OPERATIONS
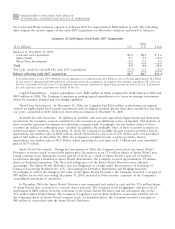
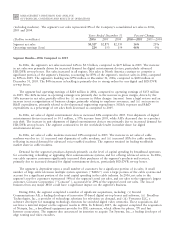
the Connected Home Solutions segment in February 2007 for approximately $200 million in cash. The following
table displays the relative impact of the early 2007 acquisitions on Motorola's domestic and non-U.S. balances:
Summary of Cash Impact from Early 2007 Acquisitions
Non-
($ in billions) U.S. U.S. Total
Balances at December 31, 2006
Cash and cash equivalents $0.3 $2.9 $ 3.2
Sigma Funds 8.7 3.5 12.2
Short-Term Investments 0.0 0.2 0.2
Total 9.0 6.6 15.6
Net Cash (used for) provided by early 2007 acquisitions* (4.3) 0.1 (4.2)
Balance reflecting early 2007 acquisitions $4.7 $6.7 $11.4
* As described above, in early 2007, Motorola used an aggregate net of approximately $4.2 billion of cash (reflecting approximately $4.6 billion
of cash spent less approximately $400 million of cash acquired from the acquisitions) to complete three strategic acquisitions. The cash used
for these acquisitions was held in the U.S. and primarily came from the liquidation of Sigma Funds investments held in the U.S. A portion of
the cash acquired in these acquisitions was outside of the U.S.
Capital Expenditures: Capital expenditures were $649 million in 2006, compared to $548 million in 2005 and
$405 million in 2004. The Company's emphasis in making capital expenditures is to focus on strategic investments
driven by customer demand and new design capability.
Short-Term Investments: At December 31, 2006, the Company had $224 million in short-term investments
(which are highly-liquid fixed-income investments with an original maturity greater than three months but less than
one year), compared to $144 million of short-term investments at December 31, 2005.
Available-For-Sale Securities: In addition to available cash and cash equivalents, Sigma Funds and short-term
investments, the Company views its available-for-sale securities as an additional source of liquidity. The majority of
these securities represent investments in technology companies and, accordingly, the fair market values of these
securities are subject to substantial price volatility. In addition, the realizable value of these securities is subject to
market and other conditions. At December 31, 2006, the Company's available-for-sale securities portfolio had an
approximate fair market value of $130 million, which represented a cost basis of $70 million and a net unrealized
gain of $60 million. At December 31, 2005, the Company's available-for-sale securities portfolio had an
approximate fair market value of $1.2 billion, which represented a cost basis of $1.1 billion and a net unrealized
gain of $157 million.
Sprint Nextel Investment: During the first quarter of 2006, the Company entered into the Sprint Nextel
Derivative to protect itself economically against price fluctuations in its 37.6 million shares of Sprint Nextel non-
voting common stock. During the second quarter of 2006, as a result of Sprint Nextel's spin-off of Embarq
Corporation through a dividend to Sprint Nextel shareholders, the Company received approximately 1.9 million
shares of Embarq Corporation. The floor and ceiling prices of the Sprint Nextel Derivative were adjusted
accordingly. The Sprint Nextel Derivative was not designated as a hedge under the provisions of Statement of
Financial Accounting Standards No. 133, ""Accounting for Derivative Instruments and Hedging Activities.''
Accordingly, to reflect the change in fair value of the Sprint Nextel Derivative, the Company recorded a net gain of
$99 million for the full year ending December 31, 2006, included in Other income (expense) in the Company's
consolidated statements of operations.
In December 2006, the Sprint Nextel Derivative was terminated and settled in cash and the 37.6 million shares
of Sprint Nextel were converted to common shares and sold. The Company received aggregate cash proceeds of
approximately $820 million from the settlement of the Sprint Nextel Derivative and the subsequent sale of the
37.6 million Sprint Nextel Shares. The Company recognized a loss of $126 million in connection with the sale of
the remaining shares of Sprint Nextel common stock. As described above, the Company recorded a net gain of
$99 million in connection with the Sprint Nextel Derivative.