Motorola 2006 Annual Report Download - page 69
Download and view the complete annual report
Please find page 69 of the 2006 Motorola annual report below. You can navigate through the pages in the report by either clicking on the pages listed below, or by using the keyword search tool below to find specific information within the annual report.-
 1
1 -
2
-
3
-
4
-
5
-
6
-
7
-
8
-
9
-
10
-
11
-
12
-
13
-
14
-
15
-
16
-
17
-
18
-
19
-
20
-
21
-
22
-
23
-
24
-
25
-
26
-
27
-
28
-
29
-
30
-
31
-
32
-
33
-
34
-
35
-
36
-
37
-
38
-
39
-
40
-
41
-
42
-
43
-
44
-
45
-
46
-
47
-
48
-
49
-
50
-
51
-
52
-
53
-
54
-
55
-
56
-
57
-
58
-
 59
59 -
 60
60 -
 61
61 -
 62
62 -
 63
63 -
 64
64 -
 65
65 -
 66
66 -
 67
67 -
 68
68 -
 69
69 -
 70
70 -
 71
71 -
 72
72 -
 73
73 -
 74
74 -
 75
75 -
 76
76 -
 77
77 -
 78
78 -
 79
79 -
80
-
81
-
82
-
83
-
84
-
85
-
86
-
87
-
88
-
89
-
90
-
91
-
92
-
93
-
94
-
95
-
96
-
97
-
98
-
99
-
100
-
101
-
102
-
103
-
104
-
105
-
106
-
107
-
108
-
109
-
110
-
111
-
112
-
113
-
114
-
115
-
116
-
117
-
118
-
119
-
120
-
121
-
122
-
123
-
124
-
125
-
126
-
127
-
128
-
129
-
130
-
131
-
132
-
133
-
134
-
135
-
136
-
137
-
138
-
139
-
140
-
141
-
142
-
143
-
144
 |
 |

61
MANAGEMENT'S DISCUSSION AND ANALYSIS
OF FINANCIAL CONDITION AND RESULTS OF OPERATIONS
Segment ResultsÌ2005 Compared to 2004
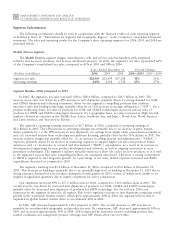
In 2005, the segment's net sales increased 23% to $2.9 billion, compared to $2.3 billion in 2004. The increase
in overall net sales was driven by increases in both ASP and unit shipments of digital entertainment devices,
particularly HD/DVR set-top boxes. Net sales increased in North America, Latin America and Asia, partially offset
by a slight decrease in net sales in EMEA. Net sales in North America accounted for 85% of the segment's total
net sales in 2005, compared to 83% in 2004. The segment's backlog was $430 million at December 31, 2005,
compared to $305 million at December 31, 2004.
The segment generated operating earnings of $153 million in 2005, compared to $154 million in 2004. The
slight decrease in operating earnings was primarily due to an increase in R&D expenditures, primarily related to
developmental engineering expenditures, partially offset by an increase in gross margin, driven by the 23% increase
in net sales. In 2005, compared to 2004, gross margin as a percentage of net sales decreased primarily due to
increased product costs due to increased sales of digital entertainment devices, mainly HD/DVR set-top boxes,
partially offset by higher ASPs on HD/DVR set-top boxes. As a percentage of net sales, for 2005 compared to
2004, SG&A expenses decreased and R&D expenditures increased.
In 2005, net sales of digital entertainment devices increased 34%, due to increases in both ASP and unit
shipments. The increase in ASP was driven by a product-mix shift towards higher-end products, particularly
HD/DVR set-top boxes. The increase in unit shipments was primarily due to the increased spending by cable
operators. The segment continued to be the worldwide leader in market share for digital cable set-top boxes.
In 2005, net sales of cable modems increased 33%. The increase in net sales was due to an increase in cable
modem unit shipments, which was partially offset by the decline in ASP for cable modems. The decrease in ASP
was primarily due to increased competition. The segment retained its leading worldwide market share in cable
modems.
Demand for the segment's products depends primarily on the level of capital spending by broadband operators
for constructing, rebuilding or upgrading their communications systems and services. After a number of years of
decreased capital spending, in 2005 and 2004 our cable operator customers increased their purchases of the
segment's products and services, primarily due to increased demand for advanced digital set-top boxes to provide
HD/DVR functionality.
In 2005, net sales to the segment's top five customers represented 53% of the segment's total net sales and net
sales to the segment's largest customer, Comcast, accounted for 31% of the segment's total net sales. The loss of
business from any major MSO could have a significant impact on the segment's business.
Significant Accounting Policies
Management's Discussion and Analysis of Financial Condition and Results of Operations discuss the
Company's consolidated financial statements, which have been prepared in accordance with U.S. generally accepted
accounting principles. The preparation of these financial statements requires management to make estimates and
assumptions that affect the reported amounts of assets and liabilities and the disclosure of contingent assets and
liabilities at the date of the financial statements, as well as the reported amounts of revenues and expenses during
the reporting period.
Management bases its estimates and judgments on historical experience, current economic and industry
conditions and on various other factors that are believed to be reasonable under the circumstances. This forms the
basis for making judgments about the carrying values of assets and liabilities that are not readily apparent from
other sources. Actual results may differ from these estimates under different assumptions or conditions.
Management believes the following significant accounting policies require significant judgment and estimates:
Ì Revenue recognition
Ì Allowance for losses on finance receivables
Ì Inventory valuation reserves
Ì Taxes on income
Ì Valuation of investments and long-lived assets