Motorola 2006 Annual Report Download - page 119
Download and view the complete annual report
Please find page 119 of the 2006 Motorola annual report below. You can navigate through the pages in the report by either clicking on the pages listed below, or by using the keyword search tool below to find specific information within the annual report.-
 1
1 -
2
-
3
-
4
-
5
-
6
-
7
-
8
-
9
-
10
-
11
-
12
-
13
-
14
-
15
-
16
-
17
-
18
-
19
-
20
-
21
-
22
-
23
-
24
-
25
-
26
-
27
-
28
-
29
-
30
-
31
-
32
-
33
-
34
-
35
-
36
-
37
-
38
-
39
-
40
-
41
-
42
-
43
-
44
-
45
-
46
-
47
-
48
-
49
-
50
-
51
-
52
-
53
-
54
-
55
-
56
-
57
-
58
-
59
-
60
-
61
-
62
-
63
-
64
-
65
-
66
-
67
-
68
-
69
-
70
-
71
-
72
-
73
-
74
-
75
-
76
-
77
-
78
-
79
-
80
-
81
-
82
-
83
-
84
-
85
-
86
-
87
-
88
-
89
-
90
-
91
-
92
-
93
-
94
-
95
-
96
-
97
-
98
-
99
-
100
-
101
-
102
-
103
-
104
-
105
-
106
-
107
-
108
-
 109
109 -
 110
110 -
 111
111 -
 112
112 -
 113
113 -
 114
114 -
 115
115 -
 116
116 -
 117
117 -
 118
118 -
 119
119 -
 120
120 -
 121
121 -
 122
122 -
 123
123 -
 124
124 -
 125
125 -
 126
126 -
 127
127 -
 128
128 -
 129
129 -
130
-
131
-
132
-
133
-
134
-
135
-
136
-
137
-
138
-
139
-
140
-
141
-
142
-
143
-
144
 |
 |

111
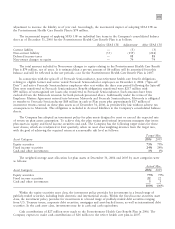
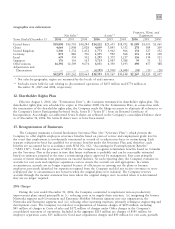
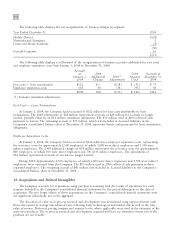
Geographic area information
Property, Plant, and
Net Sales* Assets** Equipment
Years Ended December 31 2006 2005 2004 2006 2005 2004 2006 2005 2004
United States $18,808 $16,701 $14,244 $24,212 $23,635 $18,932 $1,089 $1,010 $1,061
China 4,664 2,908 2,928 4,649 3,843 3,532 278 189 209
United Kingdom 1,306 1,532 1,452 1,773 1,962 966 134 127 132
Germany 874 882 700 1,195 990 968 131 118 138
Israel 659 534 502 1,195 1,372 1,217 156 134 125
Singapore 176 156 163 3,713 2,993 3,388 39 35 32
Other nations 16,392 12,549 9,674 6,051 4,330 5,193 498 457 388
Adjustments and
Eliminations Ì Ì Ì (4,195) (3,958) (4,048) (58) (50) (28)
$42,879 $35,262 $29,663 $38,593 $35,167 $30,148 $2,267 $2,020 $2,057
* Net sales by geographic region are measured by the locale of end customer.
** Excludes assets held for sale relating to discontinued operations of $635 million and $774 million at
December 31, 2005 and 2004, respectively.
12. Shareholder Rights Plan
Effective August 1, 2006 (the ""Termination Date''), the Company terminated its shareholder rights plan. The
shareholder rights plan was scheduled to expire in November 2008. On the Termination Date, in connection with
the termination of the shareholder rights plan, the Company made the filings necessary to eliminate all references to
the Company's Junior Participating Preferred Stock, Series B (""Series B'') from its Restated Certificate of
Incorporation. Accordingly, no authorized Series B shares are reflected in the Company's consolidated balance sheet
as of December 31, 2006. No Series B shares were or have been issued.
13. Reorganization of Businesses
The Company maintains a formal Involuntary Severance Plan (the ""Severance Plan'') which permits the
Company to offer eligible employees severance benefits based on years of service and employment grade level in
the event that employment is involuntarily terminated as a result of a reduction-in-force or restructuring. Each
separate reduction-in-force has qualified for severance benefits under the Severance Plan and, therefore, such
benefits are accounted for in accordance with SFAS No. 112, ""Accounting for Postemployment Benefits''
(""SFAS 112''). Under the provisions of SFAS 112, the Company recognizes termination benefits based on formulas
per the Severance Plan at the point in time that future settlement is probable and can be reasonably estimated
based on estimates prepared at the time a restructuring plan is approved by management. Exit costs primarily
consist of future minimum lease payments on vacated facilities. At each reporting date, the Company evaluates its
accruals for exit costs and employee separation costs to ensure the accruals are still appropriate. In certain
circumstances, accruals are no longer required because of efficiencies in carrying out the plans or because
employees previously identified for separation resigned from the Company and did not receive severance or were
redeployed due to circumstances not foreseen when the original plans were initiated. The Company reverses
accruals through the income statement line item where the original charges were recorded when it is determined
they are no longer required.
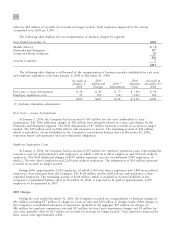
2006 Charges
During the year ended December 31, 2006, the Company committed to implement various productivity
improvement plans aimed principally at: (i) reducing costs in its supply-chain activities, (ii) integrating the former
Networks segment and Government and Enterprise Mobility Solutions segment into one organization, the
Networks and Enterprise segment, and (iii) reducing other operating expenses, primarily relating to engineering and
development costs. The Company recorded net reorganization of business charges of $213 million, including
$41 million of charges in Costs of sales and $172 million of charges under Other charges in the Company's
consolidated statement of operations. Included in the aggregate $213 million are charges of $191 million for
employee separation costs, $15 million for fixed asset impairment charges and $30 million for exit costs, partially