Motorola 2006 Annual Report Download - page 47
Download and view the complete annual report
Please find page 47 of the 2006 Motorola annual report below. You can navigate through the pages in the report by either clicking on the pages listed below, or by using the keyword search tool below to find specific information within the annual report.-
 1
1 -
2
-
3
-
4
-
5
-
6
-
7
-
8
-
9
-
10
-
11
-
12
-
13
-
14
-
15
-
16
-
17
-
18
-
19
-
20
-
21
-
22
-
23
-
24
-
25
-
26
-
27
-
28
-
29
-
30
-
31
-
32
-
33
-
34
-
35
-
36
-
 37
37 -
 38
38 -
 39
39 -
 40
40 -
 41
41 -
 42
42 -
 43
43 -
 44
44 -
 45
45 -
 46
46 -
 47
47 -
 48
48 -
 49
49 -
 50
50 -
 51
51 -
 52
52 -
 53
53 -
 54
54 -
 55
55 -
 56
56 -
 57
57 -
58
-
59
-
60
-
61
-
62
-
63
-
64
-
65
-
66
-
67
-
68
-
69
-
70
-
71
-
72
-
73
-
74
-
75
-
76
-
77
-
78
-
79
-
80
-
81
-
82
-
83
-
84
-
85
-
86
-
87
-
88
-
89
-
90
-
91
-
92
-
93
-
94
-
95
-
96
-
97
-
98
-
99
-
100
-
101
-
102
-
103
-
104
-
105
-
106
-
107
-
108
-
109
-
110
-
111
-
112
-
113
-
114
-
115
-
116
-
117
-
118
-
119
-
120
-
121
-
122
-
123
-
124
-
125
-
126
-
127
-
128
-
129
-
130
-
131
-
132
-
133
-
134
-
135
-
136
-
137
-
138
-
139
-
140
-
141
-
142
-
143
-
144
 |
 |

39
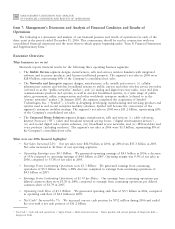
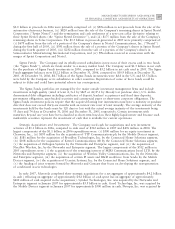
MANAGEMENT'S DISCUSSION AND ANALYSIS
OF FINANCIAL CONDITION AND RESULTS OF OPERATIONS
Results of Operations
Years Ended December 31
(Dollars in millions, except per share
amounts)
2006 % of sales
2005 % of sales 2004 % of sales
Net sales $42,879 $35,262 $29,663
Costs of sales 30,152 70.3% 23,833 67.6% 19,698 66.4%
Gross margin 12,727 29.7% 11,429 32.4% 9,965 33.6%
Selling, general and administrative expenses 4,504 10.5% 3,628 10.3% 3,508 11.8%
Research and development expenditures 4,106 9.6% 3,600 10.2% 3,316 11.2%
Other charges(income) 25 0.1% (404) (1.2)% 149 0.5%
Operating earnings 4,092 9.5% 4,605 13.1% 2,992 10.1%
Other income (expense):
Interest income (expense), net 326 0.8% 71 0.2% (200) (0.7)%
Gains on sales of investments and businesses,
net 41 0.1% 1,845 5.2% 460 1.6%
Other 151 0.4% (109) (0.3)% (140) (0.5)%
Earnings from continuing operations before
income taxes 4,610 10.8% 6,412 18.2% 3,112 10.5%
Income tax expense 1,349 3.2% 1,893 5.4% 1,013 3.4%
Earnings from continuing operations 3,261 7.6% 4,519 12.8% 2,099 7.1%
Earnings (loss) from discontinued operations,
net of tax 400 0.9% 59 0.2% (567) (1.9)%
Net earnings $ 3,661 8.5% $ 4,578 13.0% $ 1,532 5.2%
Earnings (loss) per diluted common share:
Continuing operations $ 1.30 $ 1.79 $ 0.87
Discontinued operations 0.16 0.02 (0.23)
$ 1.46 $ 1.81 $ 0.64
Geographic market sales measured by the locale of the end customer as a percent of total net sales for 2006,
2005 and 2004 are as follows:
Geographic Market Sales by Locale of End Customer
2006
2005 2004
United States 44% 47% 48%
Europe 15% 19% 19%
Asia, excluding China 11% 9% 10%
China 11% 8% 10%
Latin America 10% 10% 10%
Other Markets 9% 7% 3%
100% 100% 100%
Results of OperationsÌ2006 Compared to 2005
Net Sales
Net sales were $42.9 billion in 2006, up 22% compared to $35.3 billion in 2005. The increase in net sales
includes: (i) a $6.9 billion increase in net sales by the Mobile Devices segment, driven by a 49% increase in unit
shipments, reflecting strong demand for GSM and CDMA handsets, partially offset by an 11% decline in average
selling price (""ASP''), (ii) a $456 million increase in net sales by the Connected Home Solutions segment,
primarily due to increased demand for HD/DVR set-top boxes, and (iii) a $43 million increase in net sales by the
Networks and Enterprise segment, driven by higher net sales in the Europe, Middle East and Africa region and
Latin America, partially offset by lower net sales in North America and Asia.