Motorola 2006 Annual Report Download - page 48
Download and view the complete annual report
Please find page 48 of the 2006 Motorola annual report below. You can navigate through the pages in the report by either clicking on the pages listed below, or by using the keyword search tool below to find specific information within the annual report.-
 1
1 -
2
-
3
-
4
-
5
-
6
-
7
-
8
-
9
-
10
-
11
-
12
-
13
-
14
-
15
-
16
-
17
-
18
-
19
-
20
-
21
-
22
-
23
-
24
-
25
-
26
-
27
-
28
-
29
-
30
-
31
-
32
-
33
-
34
-
35
-
36
-
37
-
 38
38 -
 39
39 -
 40
40 -
 41
41 -
 42
42 -
 43
43 -
 44
44 -
 45
45 -
 46
46 -
 47
47 -
 48
48 -
 49
49 -
 50
50 -
 51
51 -
 52
52 -
 53
53 -
 54
54 -
 55
55 -
 56
56 -
 57
57 -
 58
58 -
59
-
60
-
61
-
62
-
63
-
64
-
65
-
66
-
67
-
68
-
69
-
70
-
71
-
72
-
73
-
74
-
75
-
76
-
77
-
78
-
79
-
80
-
81
-
82
-
83
-
84
-
85
-
86
-
87
-
88
-
89
-
90
-
91
-
92
-
93
-
94
-
95
-
96
-
97
-
98
-
99
-
100
-
101
-
102
-
103
-
104
-
105
-
106
-
107
-
108
-
109
-
110
-
111
-
112
-
113
-
114
-
115
-
116
-
117
-
118
-
119
-
120
-
121
-
122
-
123
-
124
-
125
-
126
-
127
-
128
-
129
-
130
-
131
-
132
-
133
-
134
-
135
-
136
-
137
-
138
-
139
-
140
-
141
-
142
-
143
-
144
 |
 |

40 MANAGEMENT'S DISCUSSION AND ANALYSIS
OF FINANCIAL CONDITION AND RESULTS OF OPERATIONS
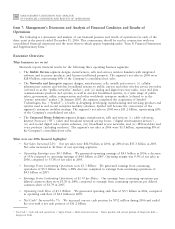
Gross Margin
Gross margin was $12.7 billion, or 29.7% of net sales, in 2006, compared to $11.4 billion, or 32.4% of net
sales, in 2005. This increase in gross margin was primarily driven by the Mobile Devices segment, due to: (i) the
49% increase in unit shipments, (ii) savings from supply chain cost-reduction initiatives, and (iii) increased income
from technology and platform licensing, partially offset by an 11% decline in ASP. The Connected Home Solutions
segment also achieved higher gross margin in 2006 compared to 2005, primarily driven by a 16% increase in net
sales. Gross margin decreased in the Networks and Enterprise segment, due to an unfavorable product/regional mix
and competitive pricing in the public networks market.
In 2006 compared to 2005, gross margin as a percentage of net sales: (i) decreased in the Mobile Devices and
Networks and Enterprise segments, and (ii) increased in the Connected Home Solutions segment. The Company's
overall gross margin as a percentage of net sales can be impacted by the proportion of overall net sales generated
by its various businesses. The decrease in overall gross margin as a percentage of net sales in 2006 compared to
2005 can be partially attributed to the fact that an increased percentage of the Company's net sales were generated
by the Mobile Devices segment, which generates lower gross margins than the overall Company average.
Selling, General and Administrative Expenses
Selling, general and administrative (""SG&A'') expenses increased 24% to $4.5 billion, or 10.5% of net sales, in
2006, compared to $3.6 billion, or 10.3% of net sales, in 2005. The increase in SG&A expenses was primarily
driven by: (i) increased marketing expenses, mainly in the Mobile Devices segment, to support higher net sales and
promote brand awareness, (ii) recognition of share-based compensation expense to SG&A-related employees in
connection with the adoption of SFAS 123R, and (iii) increased selling and sales support expenses, driven by the
increase in sales commissions from the increase in net sales. SG&A expenses as a percentage of net sales were up
slightly, driven by an increase in the Mobile Devices segment, offset by a decreased in the Connected Home
Solutions segment.
Research and Development Expenditures
Research and development (""R&D'') expenditures increased 14% to $4.1 billion, or 9.6% of net sales, in 2006,
compared to $3.6 billion, or 10.2% of net sales, in 2005. All three of the Company's operating segments had
increased R&D expenditures in 2006 compared to 2005. This increase was primarily due to: (i) developmental
engineering expenditures for new product development and investment in next-generation technologies across all
segments, and (ii) recognition of share-based compensation expense to R&D-related employees in connection with
the adoption of SFAS 123R. R&D expenditures as a percentage of net sales decreased, driven by decreases in the
Mobile Devices and Connected Home Solutions segments.
Other Charges (Income)
The Company recorded charges of $25 million in Other charges (income) in 2006, compared to income of
$404 million in 2005. The charges in 2006 include: (i) $172 million of net charges for reorganization of businesses,
(ii) $100 million of charges relating to the amortization of intangibles, (iii) an $88 million charitable contribution
to the Motorola Foundation of appreciated equity holdings in a third party, (iv) $50 million of legal reserves, and
(v) $33 million from acquisition-related in-process research and development charges (""IPR&D''), partially offset
by $418 million of income for collections relating to the Telsim settlement. The net income of $404 million in
2005 primarily consisted of $515 million of income for collections relating to the Telsim settlement, partially offset
by: (i) $67 million of charges relating to the amortization of intangibles, (ii) $54 million of net charges for
reorganization of businesses, and (iii) $2 million from acquisition-related IPR&D. The net reorganization of
businesses charges are discussed in further detail in the ""Reorganization of Businesses'' section.
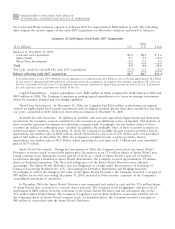
Net Interest Income (Expense)
Net interest income was $326 million in 2006, compared to net interest income of $71 million in 2005. Net
interest income in 2006 included interest income of $661 million, partially offset by interest expense of
$335 million. Net interest income in 2005 included interest income of $396 million, partially offset by interest
expense of $325 million. The increase in net interest income is primarily attributed to an increase in interest income
due to higher average cash, cash equivalents and Sigma Funds balances earning interest at higher rates.