Motorola 2006 Annual Report Download - page 82
Download and view the complete annual report
Please find page 82 of the 2006 Motorola annual report below. You can navigate through the pages in the report by either clicking on the pages listed below, or by using the keyword search tool below to find specific information within the annual report.-
 1
1 -
2
-
3
-
4
-
5
-
6
-
7
-
8
-
9
-
10
-
11
-
12
-
13
-
14
-
15
-
16
-
17
-
18
-
19
-
20
-
21
-
22
-
23
-
24
-
25
-
26
-
27
-
28
-
29
-
30
-
31
-
32
-
33
-
34
-
35
-
36
-
37
-
38
-
39
-
40
-
41
-
42
-
43
-
44
-
45
-
46
-
47
-
48
-
49
-
50
-
51
-
52
-
53
-
54
-
55
-
56
-
57
-
58
-
59
-
60
-
61
-
62
-
63
-
64
-
65
-
66
-
67
-
68
-
69
-
70
-
71
-
 72
72 -
 73
73 -
 74
74 -
 75
75 -
 76
76 -
 77
77 -
 78
78 -
 79
79 -
 80
80 -
 81
81 -
 82
82 -
 83
83 -
 84
84 -
 85
85 -
 86
86 -
 87
87 -
 88
88 -
 89
89 -
 90
90 -
 91
91 -
 92
92 -
93
-
94
-
95
-
96
-
97
-
98
-
99
-
100
-
101
-
102
-
103
-
104
-
105
-
106
-
107
-
108
-
109
-
110
-
111
-
112
-
113
-
114
-
115
-
116
-
117
-
118
-
119
-
120
-
121
-
122
-
123
-
124
-
125
-
126
-
127
-
128
-
129
-
130
-
131
-
132
-
133
-
134
-
135
-
136
-
137
-
138
-
139
-
140
-
141
-
142
-
143
-
144
 |
 |

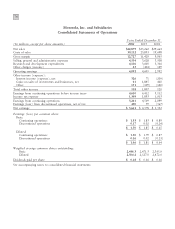
74
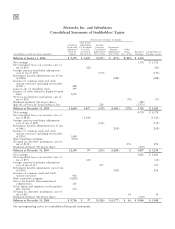
Motorola, Inc. and Subsidiaries
Consolidated Statements of Operations
Years Ended December 31
(In millions, except per share amounts)
2006
2005 2004
Net sales $42,879 $35,262 $29,663
Costs of sales 30,152 23,833 19,698
Gross margin 12,727 11,429 9,965
Selling, general and administrative expenses 4,504 3,628 3,508
Research and development expenditures 4,106 3,600 3,316
Other charges (income) 25 (404) 149
Operating earnings 4,092 4,605 2,992
Other income (expense):
Interest income (expense), net 326 71 (200)
Gains on sales of investments and businesses, net 41 1,845 460
Other 151 (109) (140)
Total other income 518 1,807 120
Earnings from continuing operations before income taxes 4,610 6,412 3,112
Income tax expense 1,349 1,893 1,013
Earnings from continuing operations 3,261 4,519 2,099
Earnings (loss) from discontinued operations, net of tax 400 59 (567)
Net earnings $ 3,661 $ 4,578 $ 1,532
Earnings (loss) per common share:
Basic:
Continuing operations $ 1.33 $ 1.83 $ 0.89
Discontinued operations 0.17 0.02 (0.24)
$ 1.50 $ 1.85 $ 0.65
Diluted:
Continuing operations $ 1.30 $ 1.79 $ 0.87
Discontinued operations 0.16 0.02 (0.23)
$ 1.46 $ 1.81 $ 0.64
Weighted average common shares outstanding:
Basic 2,446.3 2,471.3 2,365.0
Diluted 2,504.2 2,527.0 2,472.0
Dividends paid per share $ 0.18 $ 0.16 $ 0.16
See accompanying notes to consolidated financial statements.