Motorola 2006 Annual Report Download - page 56
Download and view the complete annual report
Please find page 56 of the 2006 Motorola annual report below. You can navigate through the pages in the report by either clicking on the pages listed below, or by using the keyword search tool below to find specific information within the annual report.-
 1
1 -
2
-
3
-
4
-
5
-
6
-
7
-
8
-
9
-
10
-
11
-
12
-
13
-
14
-
15
-
16
-
17
-
18
-
19
-
20
-
21
-
22
-
23
-
24
-
25
-
26
-
27
-
28
-
29
-
30
-
31
-
32
-
33
-
34
-
35
-
36
-
37
-
38
-
39
-
40
-
41
-
42
-
43
-
44
-
45
-
 46
46 -
 47
47 -
 48
48 -
 49
49 -
 50
50 -
 51
51 -
 52
52 -
 53
53 -
 54
54 -
 55
55 -
 56
56 -
 57
57 -
 58
58 -
 59
59 -
 60
60 -
 61
61 -
 62
62 -
 63
63 -
 64
64 -
 65
65 -
 66
66 -
67
-
68
-
69
-
70
-
71
-
72
-
73
-
74
-
75
-
76
-
77
-
78
-
79
-
80
-
81
-
82
-
83
-
84
-
85
-
86
-
87
-
88
-
89
-
90
-
91
-
92
-
93
-
94
-
95
-
96
-
97
-
98
-
99
-
100
-
101
-
102
-
103
-
104
-
105
-
106
-
107
-
108
-
109
-
110
-
111
-
112
-
113
-
114
-
115
-
116
-
117
-
118
-
119
-
120
-
121
-
122
-
123
-
124
-
125
-
126
-
127
-
128
-
129
-
130
-
131
-
132
-
133
-
134
-
135
-
136
-
137
-
138
-
139
-
140
-
141
-
142
-
143
-
144
 |
 |

48 MANAGEMENT'S DISCUSSION AND ANALYSIS
OF FINANCIAL CONDITION AND RESULTS OF OPERATIONS
Operating Activities
The Company has generated positive cash flow from continuing operations in each of the last six years. The
cash provided by operating activities from continuing operations in 2006 was $3.5 billion, compared to $4.3 billion
in 2005 and $2.9 billion in 2004. The primary contributors to cash flow from operations in 2006 were: (i) earnings
from continuing operations (adjusted for non-cash items) of $4.9 billion, and (ii) a $1.7 billion increase in
accounts payable and accrued liabilities. These positive contributors to operating cash flow were partially offset by:
(i) a $1.8 billion increase in accounts receivable, (ii) a $718 million increase in inventories, (iii) a $388 million
increase in other current assets, and (iv)a $215 million increase in other assets and other liabilities.
Accounts Receivable: The Company's net accounts receivable were $7.5 billion at December 31, 2006,
compared to $5.7 billion at December 31, 2005. The Company's days sales outstanding (""DSO''), including net
long-term receivables, were 58 days at December 31, 2006, compared to 51 days at December 31, 2005. The
Company's businesses sell their products in a variety of markets throughout the world. Payment terms can vary by
market type and geographic location. Accordingly, the Company's levels of accounts receivable and DSO can be
impacted by the timing and level of sales that are made by its various businesses and by the geographic locations in
which those sales are made.
Inventory: The Company's net inventory was $3.2 billion at December 31, 2006, compared to $2.4 billion at
December 31, 2005. Inventory balances increased from 2005 to 2006 primarily due to: (i) slower than expected
initial customer demand for certain products, (ii) an increase in inventory to fulfill longer-term projects, and (iii) a
business acquisition. The Company's inventory turns decreased to 11.0 at December 31, 2006, compared to 11.3 at
December 31, 2005, primarily due to slower than expected initial customer demand for certain products. Inventory
turns were calculated using an annualized rolling three months of cost of sales method. Inventory management
continues to be an area of focus as the Company balances the need to maintain strategic inventory levels to ensure
competitive delivery performance to its customers against the risk of inventory obsolescence due to rapidly changing
technology and customer spending requirements.
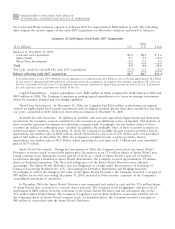
Reorganization of Businesses: The Company has implemented reorganization of businesses plans. Cash
payments for exit costs and employee separations in connection with these plans were $143 million in 2006, as
compared to $81 million in 2005. Of the $158 million reorganization of businesses accrual at December 31, 2006,
$104 million relates to employee separation costs and is expected to be paid in 2007. The remaining $54 million in
accruals relate to lease termination obligations that are expected to be paid over a number of years.
Defined Benefit Plan Contributions: The Company contributed $276 million to its U.S. pension plans during
2006, compared to $308 million contributed in 2005. The Company contributed $122 million to its non-U.S.
pension plans during 2006, compared to $62 million contributed in 2005. During 2007, the Company expects to
make cash contributions of approximately $280 million to its U.S. pension plans and approximately $120 million to
its non-U.S. pension plans. The Company contributed $27 million to its retiree health care plan in 2006, compared
to $43 million in 2005, and expects to contribute $24 million to this plan in 2007. Retirement-related benefits are
further discussed below in the ""Significant Accounting PoliciesÌRetirement-Related Benefits'' section.
Investing Activities
The most significant components of the Company's investing activities include: (i) proceeds from sales of
investments and businesses, (ii) purchases of Sigma Funds investments, (iii) strategic acquisitions of, or investments
in, other companies, and (iv) capital expenditures.
Net cash used for investing activities from continuing operations was $1.0 billion in 2006, as compared to net
cash used of $2.4 billion in 2005 and $1.6 billion in 2004. This $1.3 billion decrease in cash used for investing
activities from continuing operations was due to: (i) a $1.8 billion decrease in cash used for the purchase of Sigma
Funds investments, and (ii) a $463 million increase in proceeds from the sales of investments and businesses,
partially offset by: (i) a $756 million increase in cash used for acquisitions and investments, (ii) a $101 million
increase in capital expenditures, (iii) an $88 million increase in purchases of short-term investments, and (iv) an
$18 million decrease in proceeds received from the disposition of property, plant and equipment. The $1.6 billion
in cash used for investing activities from continuing operations in 2004 was primarily due to the initial purchase of
Sigma Funds investments.
Sales of Investments and Businesses: The Company received $2.0 billion in proceeds from the sales of
investments and businesses in 2006, compared to proceeds of $1.5 billion in 2005 and $682 million in 2004. The