Motorola 2006 Annual Report Download - page 122
Download and view the complete annual report
Please find page 122 of the 2006 Motorola annual report below. You can navigate through the pages in the report by either clicking on the pages listed below, or by using the keyword search tool below to find specific information within the annual report.-
 1
1 -
2
-
3
-
4
-
5
-
6
-
7
-
8
-
9
-
10
-
11
-
12
-
13
-
14
-
15
-
16
-
17
-
18
-
19
-
20
-
21
-
22
-
23
-
24
-
25
-
26
-
27
-
28
-
29
-
30
-
31
-
32
-
33
-
34
-
35
-
36
-
37
-
38
-
39
-
40
-
41
-
42
-
43
-
44
-
45
-
46
-
47
-
48
-
49
-
50
-
51
-
52
-
53
-
54
-
55
-
56
-
57
-
58
-
59
-
60
-
61
-
62
-
63
-
64
-
65
-
66
-
67
-
68
-
69
-
70
-
71
-
72
-
73
-
74
-
75
-
76
-
77
-
78
-
79
-
80
-
81
-
82
-
83
-
84
-
85
-
86
-
87
-
88
-
89
-
90
-
91
-
92
-
93
-
94
-
95
-
96
-
97
-
98
-
99
-
100
-
101
-
102
-
103
-
104
-
105
-
106
-
107
-
108
-
109
-
110
-
111
-
 112
112 -
 113
113 -
 114
114 -
 115
115 -
 116
116 -
 117
117 -
 118
118 -
 119
119 -
 120
120 -
 121
121 -
 122
122 -
 123
123 -
 124
124 -
 125
125 -
 126
126 -
 127
127 -
 128
128 -
 129
129 -
 130
130 -
 131
131 -
 132
132 -
133
-
134
-
135
-
136
-
137
-
138
-
139
-
140
-
141
-
142
-
143
-
144
 |
 |

114
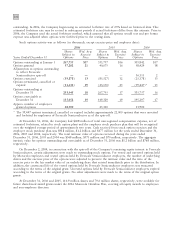
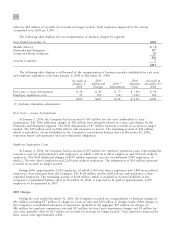
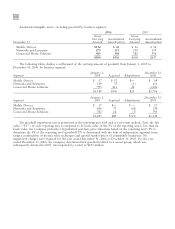
The following table displays the net reorganization of business charges by segment:
Year Ended December 31, 2004
Mobile Devices $(28)
Networks and Enterprise 2
Connected Home Solutions (4)
(30)
General Corporate 15
$(15)
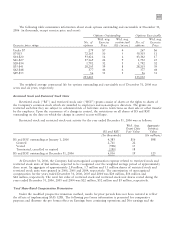
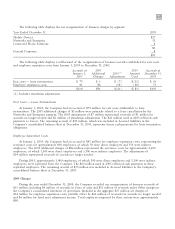
The following table displays a rollforward of the reorganization of business accruals established for exit costs
and employee separation costs from January 1, 2004 to December 31, 2004:
Accruals
at 2004 2004 Accruals at
January 1, Additional 2004(1) Amount December 31,
2004 Charges Adjustments Used 2004
Exit costs Ì lease terminations $122 $Ì $(18) $ (31) $ 73
Employee separation costs 116 54 (34) (95) 41
$238 $54 $(52) $(126) $114
(1) Includes translation adjustments.
Exit Costs Ì Lease Terminations
At January 1, 2004, the Company had an accrual of $122 million for exit costs attributable to lease
terminations. The 2004 adjustments of $18 million represented reversals of $29 million for accruals no longer
needed, partially offset by an $11 million translation adjustment. The $31 million used in 2004 reflected cash
payments to lessors. The remaining accrual of $73 million, which was included in Accrued liabilities in the
Company's consolidated balance sheet at December 31, 2004, represents future cash payments for lease termination
obligations.
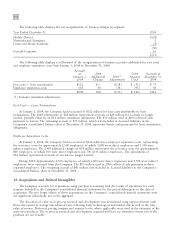
Employee Separation Costs
At January 1, 2004, the Company had an accrual of $116 million for employee separation costs, representing
the severance costs for approximately 2,100 employees, of which 1,000 were direct employees and 1,100 were
indirect employees. The 2004 additional charges of $54 million represented the severance costs for approximately
800 employees, of which 100 were direct employees and 700 were indirect employees. The adjustments of
$34 million represented reversals of accruals no longer needed.
During 2004, approximately 2,500 employees, of which 1,000 were direct employees and 1,500 were indirect
employees, were separated from the Company. The $95 million used in 2004 reflected cash payments to these
separated employees. The remaining accrual of $41 million was included in Accrued liabilities in the Company's
consolidated balance sheet at December 31, 2004.
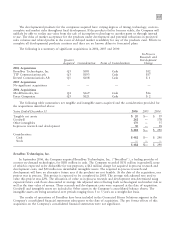
14. Acquisitions and Related Intangibles
The Company accounts for acquisitions using purchase accounting with the results of operations for each
acquiree included in the Company's consolidated financial statements for the period subsequent to the date of
acquisition. The pro forma effects of these acquisitions on the Company's consolidated financial statements were
not significant individually nor in the aggregate.
The allocation of value to in-process research and development was determined using expected future cash
flows discounted at average risk adjusted rates reflecting both technological and market risk as well as the time
value of money. Historical pricing, margins and expense levels, where applicable, were used in the valuation of the
in-process products. The in-process research and development acquired will have no alternative future uses if the
products are not feasible.