Motorola 2006 Annual Report Download - page 40
Download and view the complete annual report
Please find page 40 of the 2006 Motorola annual report below. You can navigate through the pages in the report by either clicking on the pages listed below, or by using the keyword search tool below to find specific information within the annual report.-
 1
1 -
2
-
3
-
4
-
5
-
6
-
7
-
8
-
9
-
10
-
11
-
12
-
13
-
14
-
15
-
16
-
17
-
18
-
19
-
20
-
21
-
22
-
23
-
24
-
25
-
26
-
27
-
28
-
29
-
 30
30 -
 31
31 -
 32
32 -
 33
33 -
 34
34 -
 35
35 -
 36
36 -
 37
37 -
 38
38 -
 39
39 -
 40
40 -
 41
41 -
 42
42 -
 43
43 -
 44
44 -
 45
45 -
 46
46 -
 47
47 -
 48
48 -
 49
49 -
 50
50 -
51
-
52
-
53
-
54
-
55
-
56
-
57
-
58
-
59
-
60
-
61
-
62
-
63
-
64
-
65
-
66
-
67
-
68
-
69
-
70
-
71
-
72
-
73
-
74
-
75
-
76
-
77
-
78
-
79
-
80
-
81
-
82
-
83
-
84
-
85
-
86
-
87
-
88
-
89
-
90
-
91
-
92
-
93
-
94
-
95
-
96
-
97
-
98
-
99
-
100
-
101
-
102
-
103
-
104
-
105
-
106
-
107
-
108
-
109
-
110
-
111
-
112
-
113
-
114
-
115
-
116
-
117
-
118
-
119
-
120
-
121
-
122
-
123
-
124
-
125
-
126
-
127
-
128
-
129
-
130
-
131
-
132
-
133
-
134
-
135
-
136
-
137
-
138
-
139
-
140
-
141
-
142
-
143
-
144
 |
 |

32
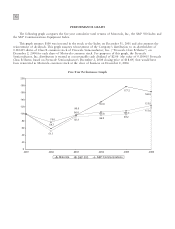
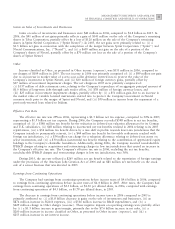
PERFORMANCE GRAPH
The following graph compares the five-year cumulative total returns of Motorola, Inc., the S&P 500 Index and
the S&P Communications Equipment Index.
This graph assumes $100 was invested in the stock or the Index on December 31, 2001 and also assumes the
reinvestment of dividends. This graph assumes reinvestment of the Company's distribution to its shareholders of
0.110415 shares of Class B common stock of Freescale Semiconductor, Inc. (""Freescale Class B Shares'') on
December 2, 2004 for each share of Motorola common stock. For purposes of this graph, the Freescale
Semiconductor, Inc. distribution is treated as a non-taxable cash dividend of $2.06 (the value of 0.110415 Freescale
Class B Shares, based on Freescale Semiconductor's December 2, 2004 closing price of $18.69) that would have
been reinvested in Motorola common stock at the close of business on December 2, 2004.
Five-Year Performance Graph
162.8
58.7
177.2
134.0
96.0
123.5
76.6
108.7
105.6
96.9
117.6
51.7
92.3 96.0 98.2
0
20
40
60
80
100
120
140
160
180
200
2001 2002 2003 2004 2005 2006
S&P Communications
S&P 500
Motorola