Motorola 2006 Annual Report Download - page 68
Download and view the complete annual report
Please find page 68 of the 2006 Motorola annual report below. You can navigate through the pages in the report by either clicking on the pages listed below, or by using the keyword search tool below to find specific information within the annual report.-
 1
1 -
2
-
3
-
4
-
5
-
6
-
7
-
8
-
9
-
10
-
11
-
12
-
13
-
14
-
15
-
16
-
17
-
18
-
19
-
20
-
21
-
22
-
23
-
24
-
25
-
26
-
27
-
28
-
29
-
30
-
31
-
32
-
33
-
34
-
35
-
36
-
37
-
38
-
39
-
40
-
41
-
42
-
43
-
44
-
45
-
46
-
47
-
48
-
49
-
50
-
51
-
52
-
53
-
54
-
55
-
56
-
57
-
 58
58 -
 59
59 -
 60
60 -
 61
61 -
 62
62 -
 63
63 -
 64
64 -
 65
65 -
 66
66 -
 67
67 -
 68
68 -
 69
69 -
 70
70 -
 71
71 -
 72
72 -
 73
73 -
 74
74 -
 75
75 -
 76
76 -
 77
77 -
 78
78 -
79
-
80
-
81
-
82
-
83
-
84
-
85
-
86
-
87
-
88
-
89
-
90
-
91
-
92
-
93
-
94
-
95
-
96
-
97
-
98
-
99
-
100
-
101
-
102
-
103
-
104
-
105
-
106
-
107
-
108
-
109
-
110
-
111
-
112
-
113
-
114
-
115
-
116
-
117
-
118
-
119
-
120
-
121
-
122
-
123
-
124
-
125
-
126
-
127
-
128
-
129
-
130
-
131
-
132
-
133
-
134
-
135
-
136
-
137
-
138
-
139
-
140
-
141
-
142
-
143
-
144
 |
 |

60 MANAGEMENT'S DISCUSSION AND ANALYSIS
OF FINANCIAL CONDITION AND RESULTS OF OPERATIONS
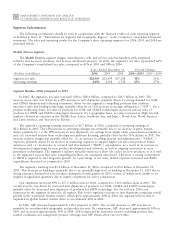
(including modems). The segment's net sales represented 8% of the Company's consolidated net sales in 2006,
2005 and 2004.
Years Ended December 31 Percent Change
(Dollars in millions)
2006
2005 2004
2006Ì2005
2005Ì2004
Segment net sales $3,327 $2,871 $2,335 16% 23%
Operating earnings (loss) 224 153 154 46% 0%
Segment ResultsÌ2006 Compared to 2005
In 2006, the segment's net sales increased 16% to $3.3 billion, compared to $2.9 billion in 2005. The increase
in net sales was primarily driven by increased demand for digital entertainment devices, particularly advanced
HD/DVR set-top boxes. Net sales increased in all regions. Net sales in North America continue to comprise a
significant portion of the segment's business, accounting for 83% of the segment's total net sales in 2006, compared
to 85% in 2005. The segment's backlog was $792 million at December 31, 2006, compared to $430 million at
December 31, 2005. The 84% increase in backlog is primarily due to strong orders for our digital and HD/DVR
set-top boxes.
The segment had operating earnings of $224 million in 2006, compared to operating earnings of $153 million
in 2005. The 46% increase in operating earnings was primarily due to the increase in gross margin, driven by the
16% increase in net sales, partially offset by: (i) an increase in Other charges (income) from a legal reserve and an
increase in net reorganization of business charges, primarily relating to employee severance, and (ii) an increase in
R&D expenditures, primarily related to developmental engineering expenditures. SG&A expenses and R&D
expenditures as a percentage of net sales both decreased as compared to 2005.
In 2006, net sales of digital entertainment devices increased 24% compared to 2005. Unit shipments of digital
entertainment devices increased to 10.1 million, a 57% increase from 2005, while ASPs decreased due to a product
mix shift. The increase in unit shipments of digital entertainment devices was primarily due to increased demand for
HD/DVR set-top boxes. The segment continued to be the worldwide leader in market share for digital
entertainment devices.
In 2006, net sales of cable modems increased 18% compared to 2005. The increase in net sales of cable
modems was due to: (i) increased unit shipments of cable modems, and (ii) increased ASPs for cable modems,
reflecting increased demand for advanced voice-enabled modems. The segment retained its leading worldwide
market share in cable modems.
Demand for the segment's products depends primarily on the level of capital spending by broadband operators
for constructing, rebuilding or upgrading their communications systems, and for offering advanced services. In 2006,
our cable operator customers significantly increased their purchases of the segment's products and services,
primarily due to increased demand for digital entertainment devices, particularly HD/DVR set-top boxes.
The segment is dependent upon a small number of customers for a significant portion of its sales. A small
number of large cable television multiple system operators (""MSOs'') own a large portion of the cable systems and
account for a significant portion of the total capital spending in the cable industry. In 2006, net sales to the
segment's top five customers represented 54% of the segment's total net sales, and net sales to the segment's largest
customer, Comcast Corporation (""Comcast''), accounted for 29% of the segment's total net sales. The loss of
business from any major MSO could have a significant impact on the segment's business.
During 2006, the segment completed a number of significant acquisitions, including: (i) Kreatel
Communications AB, a leading developer of innovative IP-based digital set-top boxes and software, (ii) Broadbus
Technologies, Inc., a provider of technology solutions for television on demand, and (iii) Vertasent LLC, a
software developer for managing technology elements for switched digital video networks. These acquisitions did
not have a material impact on the segment results in 2006. In February 2007, the segment completed the acquisition
of Netopia, Inc., a broadband equipment provider for DSL customers, which allows for phone, TV and fast
Internet connections. The segment also announced its intention to acquire Tut Systems, Inc., a leading developer of
edge routing and video encoders.