Medtronic 2014 Annual Report Download - page 98
Download and view the complete annual report
Please find page 98 of the 2014 Medtronic annual report below. You can navigate through the pages in the report by either clicking on the pages listed below, or by using the keyword search tool below to find specific information within the annual report.-
 1
1 -
2
-
3
-
4
-
5
-
6
-
7
-
8
-
9
-
10
-
11
-
12
-
13
-
14
-
15
-
16
-
17
-
18
-
19
-
20
-
21
-
22
-
23
-
24
-
25
-
26
-
27
-
28
-
29
-
30
-
31
-
32
-
33
-
34
-
35
-
36
-
37
-
38
-
39
-
40
-
41
-
42
-
43
-
44
-
45
-
46
-
47
-
48
-
49
-
50
-
51
-
52
-
53
-
54
-
55
-
56
-
57
-
58
-
59
-
60
-
61
-
62
-
63
-
64
-
65
-
66
-
67
-
68
-
69
-
70
-
71
-
72
-
73
-
74
-
75
-
76
-
77
-
78
-
79
-
80
-
81
-
82
-
83
-
84
-
85
-
86
-
87
-
 88
88 -
 89
89 -
 90
90 -
 91
91 -
 92
92 -
 93
93 -
 94
94 -
 95
95 -
 96
96 -
 97
97 -
 98
98 -
 99
99 -
 100
100 -
 101
101 -
 102
102 -
 103
103 -
 104
104 -
 105
105 -
 106
106 -
 107
107 -
 108
108 -
109
-
110
-
111
-
112
-
113
-
114
-
115
-
116
-
117
-
118
-
119
-
120
-
121
-
122
-
123
-
124
-
125
-
126
-
127
-
128
-
129
-
130
-
131
-
132
-
133
-
134
-
135
-
136
-
137
-
138
-
139
-
140
-
141
-
142
-
143
-
144
-
145
-
146
-
147
 |
 |

Medtronic, Inc.
Notes to Consolidated Financial Statements (Continued)
related liabilities for all acquisitions subsequent to April 24, 2009. See Note 4 for further information regarding contingent
consideration.
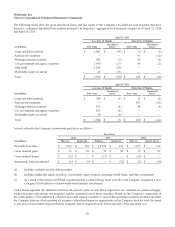
The following table represents the range of the unobservable inputs utilized in the fair value measurement of the auction rate
securities classified as Level 3 as of April 25, 2014:
Valuation
Technique Unobservable Input
Range
(Weighted Average)
Auction rate securities Discounted cash flow Years to principal recovery
Illiquidity premium
2 yrs. - 12 yrs. (3 yrs.)
6%
The Company reviews the fair value hierarchy classification on a quarterly basis. Changes in the ability to observe valuation
inputs may result in a reclassification of levels for certain securities within the fair value hierarchy. The Company’s policy is to
recognize transfers into and out of levels within the fair value hierarchy at the end of the fiscal quarter in which the actual event
or change in circumstances that caused the transfer occurs. There were no transfers between Level 1, Level 2, or Level 3 during
the fiscal years ended April 25, 2014 or April 26, 2013. When a determination is made to classify an asset or liability within
Level 3, the determination is based upon the significance of the unobservable inputs to the overall fair value measurement.
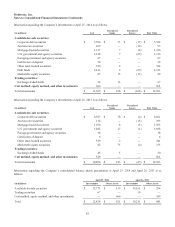
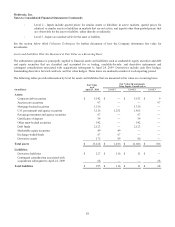
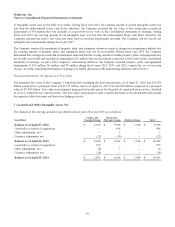
The following table provides a reconciliation of the beginning and ending balances of items measured at fair value on a
recurring basis that used significant unobservable inputs (Level 3):
(in millions)
Total Level 3
Investments
Corporate debt
securities
Auction rate
securities
Mortgage-
backed securities
Other asset-
backed securities
Balance as of April 26, 2013 $ 127 $ 10 $ 103 $ 14 $ —
Total realized losses and other-than-
temporary impairment losses included
in earnings (5) — (5) — —
Total unrealized gains included in
other comprehensive income 4 — 3 1 —
Settlements (20) (1) (4) (15) —
Balance as of April 25, 2014 $ 106$ 9$ 97$ —$ —
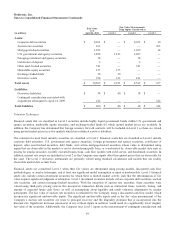
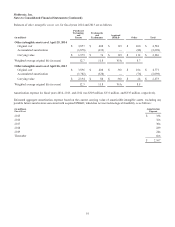
(in millions)
Total Level 3
Investments
Corporate debt
securities
Auction rate
securities
Mortgage-
backed securities
Other asset-
backed securities
Balance as of April 27, 2012 $ 172 $ 10 $ 127 $ 29 $ 6
Total unrealized gains included in
other comprehensive income 11 — 11 — —
Settlements (56) — (35) (15) (6)
Balance as of April 26, 2013 $ 127 $ 10 $ 103 $ 14 $ —
Assets and Liabilities That Are Measured at Fair Value on a Nonrecurring Basis
Non-financial assets such as equity and other securities that are accounted for using the cost or equity method, goodwill and
IPR&D, intangible assets, and property, plant, and equipment are measured at fair value when there is an indicator of
impairment and recorded at fair value only when an impairment is recognized.
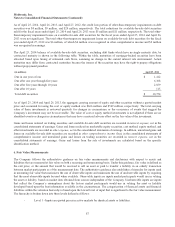
The Company holds investments in equity and other securities that are accounted for using the cost or equity method, which are
classified as other assets in the consolidated balance sheets. The aggregate carrying amount of these investments was
$666 million as of April 25, 2014 and $549 million as of April 26, 2013. These cost or equity method investments are measured
at fair value on a nonrecurring basis. The fair value of the Company’s cost or equity method investments is not estimated if
there are no identified events or changes in circumstance that may have a significant adverse effect on the fair value of these
90