Medtronic 2014 Annual Report Download - page 94
Download and view the complete annual report
Please find page 94 of the 2014 Medtronic annual report below. You can navigate through the pages in the report by either clicking on the pages listed below, or by using the keyword search tool below to find specific information within the annual report.-
 1
1 -
2
-
3
-
4
-
5
-
6
-
7
-
8
-
9
-
10
-
11
-
12
-
13
-
14
-
15
-
16
-
17
-
18
-
19
-
20
-
21
-
22
-
23
-
24
-
25
-
26
-
27
-
28
-
29
-
30
-
31
-
32
-
33
-
34
-
35
-
36
-
37
-
38
-
39
-
40
-
41
-
42
-
43
-
44
-
45
-
46
-
47
-
48
-
49
-
50
-
51
-
52
-
53
-
54
-
55
-
56
-
57
-
58
-
59
-
60
-
61
-
62
-
63
-
64
-
65
-
66
-
67
-
68
-
69
-
70
-
71
-
72
-
73
-
74
-
75
-
76
-
77
-
78
-
79
-
80
-
81
-
82
-
83
-
 84
84 -
 85
85 -
 86
86 -
 87
87 -
 88
88 -
 89
89 -
 90
90 -
 91
91 -
 92
92 -
 93
93 -
 94
94 -
 95
95 -
 96
96 -
 97
97 -
 98
98 -
 99
99 -
 100
100 -
 101
101 -
 102
102 -
 103
103 -
 104
104 -
105
-
106
-
107
-
108
-
109
-
110
-
111
-
112
-
113
-
114
-
115
-
116
-
117
-
118
-
119
-
120
-
121
-
122
-
123
-
124
-
125
-
126
-
127
-
128
-
129
-
130
-
131
-
132
-
133
-
134
-
135
-
136
-
137
-
138
-
139
-
140
-
141
-
142
-
143
-
144
-
145
-
146
-
147
 |
 |

Medtronic, Inc.
Notes to Consolidated Financial Statements (Continued)
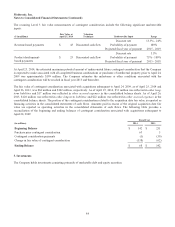
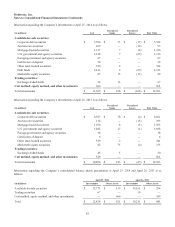
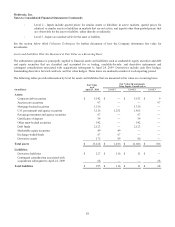
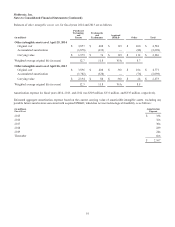
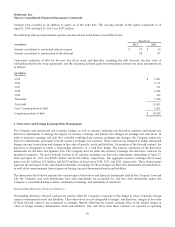
The following tables show the gross unrealized losses and fair values of the Company’s available-for-sale securities that have
been in a continuous unrealized loss position deemed to be temporary, aggregated by investment category as of April 25, 2014
and April 26, 2013:
April 25, 2014
Less than 12 Months More than 12 Months
(in millions) Fair Value
Unrealized
Losses Fair Value
Unrealized
Losses
Corporate debt securities $ 1,601 $ (14) $ 50 $ (3)
Auction rate securities — — 97 (12)
Mortgage-backed securities 682 (7) 28 (1)
U.S. government and agency securities 1,500 (27) 46 (2)
Debt funds 1,224 (29) — —
Marketable equity securities 25 (13) — —
Total $ 5,032 $ (90) $ 221 $ (18)
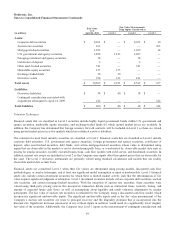
April 26, 2013
Less than 12 Months More than 12 Months
(in millions) Fair Value
Unrealized
Losses Fair Value
Unrealized
Losses
Corporate debt securities $ 544 $ (1) $ 13 $ (3)
Auction rate securities — — 103 (15)
Mortgage-backed securities 195 (1) 44 (4)
U.S. government and agency securities 291 (1) — —
Marketable equity securities 14 (2) — —
Total $ 1,044 $ (5) $ 160 $ (22)
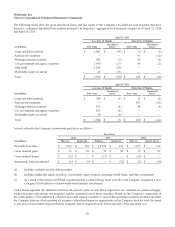
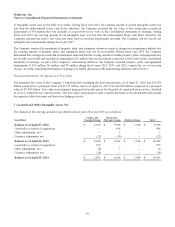
Activity related to the Company’s investment portfolio is as follows:
Fiscal Year
2014 2013 2012
(in millions) Debt (a) Equity (b) Debt (a) Equity (b) Debt (a) Equity (b) (c)
Proceeds from sales $ 7,991 $ 120 $ 10,350 $ 161 $ 7,675 $ 113
Gross realized gains $ 15 $ 69 $ 59 $ 94 $ 52 $ 93
Gross realized losses $ (12) $ — $ (17) $ — $ (16) $ —
Impairment losses recognized $ (1) $ (9) $ — $ (21) $ (2) $ (10)
(a) Includes available-for-sale debt securities.
(b) Includes marketable equity securities, cost method, equity method, exchange-traded funds, and other investments.
(c) As a result of the Salient and PEAK acquisitions that occurred during fiscal year 2012, the Company recognized a non-
cash gain of $38 million on its previously-held minority investments.
Credit losses represent the difference between the present value of cash flows expected to be collected on certain mortgage-
backed securities and auction rate securities and the amortized cost of these securities. Based on the Company’s assessment of
the credit quality of the underlying collateral and credit support available to each of the remaining securities in which invested,
the Company believes it has recorded all necessary other-than-temporary impairments as the Company does not have the intent
to sell, nor is it more likely than not that the Company will be required to sell, before recovery of the amortized cost.
86