Medtronic 2014 Annual Report Download - page 112
Download and view the complete annual report
Please find page 112 of the 2014 Medtronic annual report below. You can navigate through the pages in the report by either clicking on the pages listed below, or by using the keyword search tool below to find specific information within the annual report.-
 1
1 -
2
-
3
-
4
-
5
-
6
-
7
-
8
-
9
-
10
-
11
-
12
-
13
-
14
-
15
-
16
-
17
-
18
-
19
-
20
-
21
-
22
-
23
-
24
-
25
-
26
-
27
-
28
-
29
-
30
-
31
-
32
-
33
-
34
-
35
-
36
-
37
-
38
-
39
-
40
-
41
-
42
-
43
-
44
-
45
-
46
-
47
-
48
-
49
-
50
-
51
-
52
-
53
-
54
-
55
-
56
-
57
-
58
-
59
-
60
-
61
-
62
-
63
-
64
-
65
-
66
-
67
-
68
-
69
-
70
-
71
-
72
-
73
-
74
-
75
-
76
-
77
-
78
-
79
-
80
-
81
-
82
-
83
-
84
-
85
-
86
-
87
-
88
-
89
-
90
-
91
-
92
-
93
-
94
-
95
-
96
-
97
-
98
-
99
-
100
-
101
-
 102
102 -
 103
103 -
 104
104 -
 105
105 -
 106
106 -
 107
107 -
 108
108 -
 109
109 -
 110
110 -
 111
111 -
 112
112 -
 113
113 -
 114
114 -
 115
115 -
 116
116 -
 117
117 -
 118
118 -
 119
119 -
 120
120 -
 121
121 -
 122
122 -
123
-
124
-
125
-
126
-
127
-
128
-
129
-
130
-
131
-
132
-
133
-
134
-
135
-
136
-
137
-
138
-
139
-
140
-
141
-
142
-
143
-
144
-
145
-
146
-
147
 |
 |

Medtronic, Inc.
Notes to Consolidated Financial Statements (Continued)
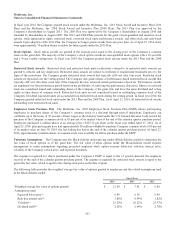
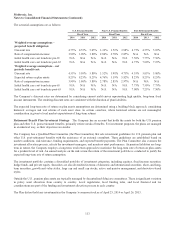
(a) Expected life: The Company analyzes historical employee stock option exercise and termination data to estimate the
expected life assumption. The Company calculates the expected life assumption using the midpoint scenario, which
combines historical exercise data with hypothetical exercise data, as the Company believes this data currently represents
the best estimate of the expected life of a new employee option. The Company also stratifies its employee population
into two groups based upon distinctive exercise behavior patterns.
(b) Risk-free interest rate: The rate is based on the grant date yield of a zero-coupon U.S. Treasury bond whose maturity
period equals the expected term of the option.
(c) Volatility: Expected volatility is based on a blend of historical volatility and an implied volatility of the Company’s
common stock. Implied volatility is based on market traded options of the Company’s common stock.
(d) Dividend yield: The dividend yield rate is calculated by dividing the Company’s annual dividend, based on the most
recent quarterly dividend rate, by the closing stock price on the grant date.
Stock-Based Compensation Expense Under the fair value recognition provisions of U.S. GAAP for accounting for stock-
based compensation, the Company measures stock-based compensation expense at the grant date based on the fair value of the
award and recognizes the compensation expense over the requisite service period, which is generally the vesting period.
The amount of stock-based compensation expense recognized during a period is based on the portion of the awards that are
ultimately expected to vest. The Company estimates pre-vesting forfeitures at the time of grant by analyzing historical data and
revises those estimates in subsequent periods if actual forfeitures differ from those estimates. Ultimately, the total expense
recognized over the vesting period will equal the fair value of awards that actually vest.
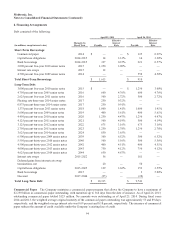
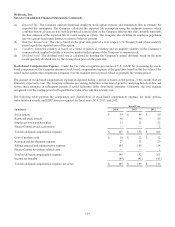
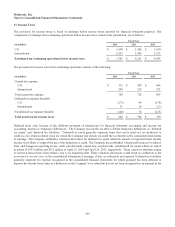
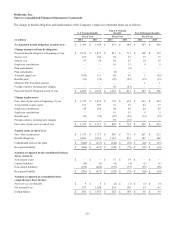
The following table presents the components and classification of stock-based compensation expense, for stock options,
restricted stock awards, and ESPP shares recognized for fiscal years 2014, 2013, and 2012:
Fiscal Year
(in millions) 2014 2013 2012
Stock options $ 34 $ 44 $ 60
Restricted stock awards 98 96 86
Employees stock purchase plan 13 12 13
Physio-Control award acceleration — — 2
Total stock-based compensation expense $ 145 $ 152 $ 161
Cost of products sold $ 14 $ 12 $ 12
Research and development expense 27 31 29
Selling, general, and administrative expense 104 109 118
Physio-Control divestiture-related costs — — 2
Total stock-based compensation expense 145 152 161
Income tax benefits (40) (43) (45)
Total stock-based compensation expense, net of tax $ 105 $ 109 $ 116
104