Medtronic 2014 Annual Report Download - page 134
Download and view the complete annual report
Please find page 134 of the 2014 Medtronic annual report below. You can navigate through the pages in the report by either clicking on the pages listed below, or by using the keyword search tool below to find specific information within the annual report.-
 1
1 -
2
-
3
-
4
-
5
-
6
-
7
-
8
-
9
-
10
-
11
-
12
-
13
-
14
-
15
-
16
-
17
-
18
-
19
-
20
-
21
-
22
-
23
-
24
-
25
-
26
-
27
-
28
-
29
-
30
-
31
-
32
-
33
-
34
-
35
-
36
-
37
-
38
-
39
-
40
-
41
-
42
-
43
-
44
-
45
-
46
-
47
-
48
-
49
-
50
-
51
-
52
-
53
-
54
-
55
-
56
-
57
-
58
-
59
-
60
-
61
-
62
-
63
-
64
-
65
-
66
-
67
-
68
-
69
-
70
-
71
-
72
-
73
-
74
-
75
-
76
-
77
-
78
-
79
-
80
-
81
-
82
-
83
-
84
-
85
-
86
-
87
-
88
-
89
-
90
-
91
-
92
-
93
-
94
-
95
-
96
-
97
-
98
-
99
-
100
-
101
-
102
-
103
-
104
-
105
-
106
-
107
-
108
-
109
-
110
-
111
-
112
-
113
-
114
-
115
-
116
-
117
-
118
-
119
-
120
-
121
-
122
-
123
-
 124
124 -
 125
125 -
 126
126 -
 127
127 -
 128
128 -
 129
129 -
 130
130 -
 131
131 -
 132
132 -
 133
133 -
 134
134 -
 135
135 -
 136
136 -
 137
137 -
 138
138 -
 139
139 -
 140
140 -
 141
141 -
 142
142 -
 143
143 -
 144
144 -
145
-
146
-
147
 |
 |

Medtronic, Inc.
Notes to Consolidated Financial Statements (Continued)
20. Segment and Geographic Information
The Company’s management evaluates performance and allocates resources based on profit and loss from operations before
income taxes and interest expense, net, not including special charges, restructuring charges, net, certain litigation charges, net,
acquisition-related items, and certain tax adjustments. The accounting policies of the reportable segments are the same as those
described in the summary of significant accounting policies in Note 1.
In the first quarter of fiscal year 2014, the Company amended the way in which management evaluates performance and
allocates resources for the Diabetes business including separating the Diabetes business from the Restorative Therapies Group.
As a result, the Company began to operate under three reportable segments and three operating segments with the Diabetes
business operating as a separate group. Accordingly, the segment information for the prior years has been restated to present
three reportable segments.
The Company’s Cardiac and Vascular Group consists of four businesses: Cardiac Rhythm Disease Management (CRDM),
Coronary, Structural Heart, and Endovascular. The primary products sold by this operating segment include those for cardiac
rhythm disorders and cardiovascular disease. The Company’s Restorative Therapies Group consists of three businesses: Spine,
Neuromodulation, and Surgical Technologies. The primary products sold by this operating segment include those for spinal
conditions and musculoskeletal trauma, neurological disorders, urological and digestive disorders, and ear, nose, and throat
conditions. The primary products sold by the Company’s Diabetes Group include those for diabetes management.
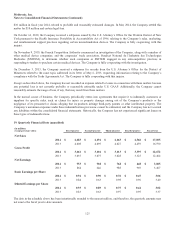
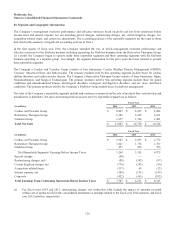
Net sales of the Company’s reportable segments include end-customer revenues from the sale of products they each develop and
manufacture or distribute. Net sales and earnings before income taxes by reportable segment are as follows:
Fiscal Year
(in millions) 2014 2013 2012
Cardiac and Vascular Group $ 8,847 $ 8,695 $ 8,482
Restorative Therapies Group 6,501 6,369 6,221
Diabetes Group 1,657 1,526 1,481
Total Net Sales $ 17,005 $ 16,590 $ 16,184
Fiscal Year
(in millions) 2014 2013 2012
Cardiac and Vascular Group $ 2,982 $ 2,935 $ 2,772
Restorative Therapies Group 1,821 1,778 1,707
Diabetes Group 457 432 396
Total Reportable Segments’ Earnings Before Income Taxes 5,260 5,145 4,875
Special charges (40) — —
Restructuring charges, net(a) (88) (182) (87)
Certain litigation charges, net (770) (245) (90)
Acquisition-related items (117) 49 (12)
Interest expense, net (108) (151) (149)
Corporate (432) (365) (392)
Total Earnings From Continuing Operations Before Income Taxes $ 3,705 $ 4,251 $ 4,145
(a) For fiscal years 2014 and 2013, restructuring charges, net within this table include the impact of amounts recorded
within cost of products sold in the consolidated statements of earnings related to the fiscal year 2014 initiative and fiscal
year 2013 initiative, respectively.
126