Medtronic 2014 Annual Report Download - page 121
Download and view the complete annual report
Please find page 121 of the 2014 Medtronic annual report below. You can navigate through the pages in the report by either clicking on the pages listed below, or by using the keyword search tool below to find specific information within the annual report.-
 1
1 -
2
-
3
-
4
-
5
-
6
-
7
-
8
-
9
-
10
-
11
-
12
-
13
-
14
-
15
-
16
-
17
-
18
-
19
-
20
-
21
-
22
-
23
-
24
-
25
-
26
-
27
-
28
-
29
-
30
-
31
-
32
-
33
-
34
-
35
-
36
-
37
-
38
-
39
-
40
-
41
-
42
-
43
-
44
-
45
-
46
-
47
-
48
-
49
-
50
-
51
-
52
-
53
-
54
-
55
-
56
-
57
-
58
-
59
-
60
-
61
-
62
-
63
-
64
-
65
-
66
-
67
-
68
-
69
-
70
-
71
-
72
-
73
-
74
-
75
-
76
-
77
-
78
-
79
-
80
-
81
-
82
-
83
-
84
-
85
-
86
-
87
-
88
-
89
-
90
-
91
-
92
-
93
-
94
-
95
-
96
-
97
-
98
-
99
-
100
-
101
-
102
-
103
-
104
-
105
-
106
-
107
-
108
-
109
-
110
-
 111
111 -
 112
112 -
 113
113 -
 114
114 -
 115
115 -
 116
116 -
 117
117 -
 118
118 -
 119
119 -
 120
120 -
 121
121 -
 122
122 -
 123
123 -
 124
124 -
 125
125 -
 126
126 -
 127
127 -
 128
128 -
 129
129 -
 130
130 -
 131
131 -
132
-
133
-
134
-
135
-
136
-
137
-
138
-
139
-
140
-
141
-
142
-
143
-
144
-
145
-
146
-
147
 |
 |

Medtronic, Inc.
Notes to Consolidated Financial Statements (Continued)
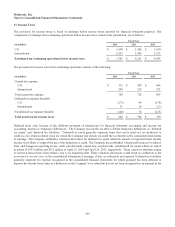
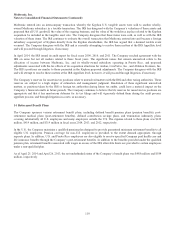
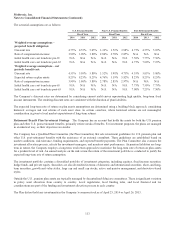
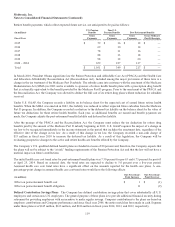
The actuarial assumptions are as follows:
U.S. Pension Benefits Non-U.S. Pension Benefits Post-Retirement Benefits
Fiscal Year Fiscal Year Fiscal Year
2014 2013 2012 2014 2013 2012 2014 2013 2012
Weighted average assumptions –
projected benefit obligation:
Discount rate 4.75% 4.55% 5.05% 3.32% 3.52% 3.98% 4.75% 4.55% 5.05%
Rate of compensation increase 3.90% 3.90% 3.80% 2.80% 2.78% 2.85% N/A N/A N/A
Initial health care cost trend rate pre-65 N/A N/A N/A N/A N/A N/A 7.50% 7.75% 7.50%
Initial health care cost trend rate post-65 N/A N/A N/A N/A N/A N/A 6.75% 7.00% 7.25%
Weighted average assumptions – net
periodic benefit cost:
Discount rate 4.55% 5.05% 5.80% 3.52% 3.98% 4.75% 4.55% 5.05% 5.80%
Expected return on plan assets 8.25% 8.25% 8.25% 4.76% 5.19% 5.82% 8.25% 8.25% 8.25%
Rate of compensation increase 3.90% 3.80% 3.80% 2.78% 2.85% 2.97% N/A N/A N/A
Initial health care cost trend rate pre-65 N/A N/A N/A N/A N/A N/A 7.75% 7.50% 7.75%
Initial health care cost trend rate post-65 N/A N/A N/A N/A N/A N/A 7.00% 7.25% 7.50%
The Company’s discount rates are determined by considering current yield curves representing high quality, long-term fixed
income instruments. The resulting discount rates are consistent with the duration of plan liabilities.
The expected long-term rate of return on plan assets assumptions are determined using a building block approach, considering
historical averages and real returns of each asset class. In certain countries, where historical returns are not meaningful,
consideration is given to local market expectations of long-term returns.
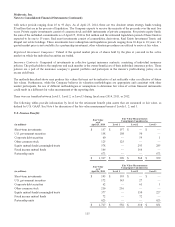
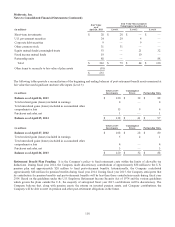
Retirement Benefit Plan Investment Strategy The Company has an account that holds the assets for both the U.S. pension
plan and other U.S. post-retirement benefits, primarily retiree medical benefits. For investment purposes, the plans are managed
in an identical way, as their objectives are similar.
The Company has a Qualified Plan Committee (the Plan Committee) that sets investment guidelines for U.S. pension plan and
other U.S. post-retirement benefits with the assistance of an external consultant. These guidelines are established based on
market conditions, risk tolerance, funding requirements, and expected benefit payments. The Plan Committee also oversees the
investment allocation process, selects the investment managers, and monitors asset performance. As pension liabilities are long-
term in nature, the Company employs a long-term total return approach to maximize the long-term rate of return on plan assets
for a prudent level of risk. An annual analysis on the risk versus the return of the investment portfolio is conducted to justify the
expected long-term rate of return assumption.
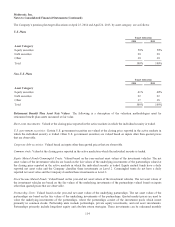
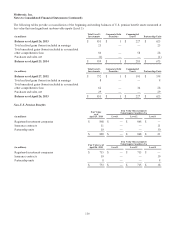
The investment portfolio contains a diversified portfolio of investment categories, including equities, fixed income securities,
hedge funds, and private equity. Securities are also diversified in terms of domestic and international securities, short- and long-
term securities, growth and value styles, large cap and small cap stocks, active and passive management, and derivative-based
styles.
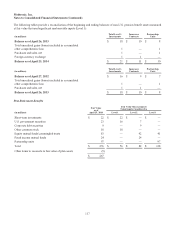
Outside the U.S., pension plan assets are typically managed by decentralized fiduciary committees. There is significant variation
in policy asset allocation from country to country. Local regulations, local funding rules, and local financial and tax
considerations are part of the funding and investment allocation process in each country.
The Plan did not hold any investments in the Company’s common stock as of April 25, 2014 or April 26, 2013.
113