Medtronic 2014 Annual Report Download - page 93
Download and view the complete annual report
Please find page 93 of the 2014 Medtronic annual report below. You can navigate through the pages in the report by either clicking on the pages listed below, or by using the keyword search tool below to find specific information within the annual report.-
 1
1 -
2
-
3
-
4
-
5
-
6
-
7
-
8
-
9
-
10
-
11
-
12
-
13
-
14
-
15
-
16
-
17
-
18
-
19
-
20
-
21
-
22
-
23
-
24
-
25
-
26
-
27
-
28
-
29
-
30
-
31
-
32
-
33
-
34
-
35
-
36
-
37
-
38
-
39
-
40
-
41
-
42
-
43
-
44
-
45
-
46
-
47
-
48
-
49
-
50
-
51
-
52
-
53
-
54
-
55
-
56
-
57
-
58
-
59
-
60
-
61
-
62
-
63
-
64
-
65
-
66
-
67
-
68
-
69
-
70
-
71
-
72
-
73
-
74
-
75
-
76
-
77
-
78
-
79
-
80
-
81
-
82
-
 83
83 -
 84
84 -
 85
85 -
 86
86 -
 87
87 -
 88
88 -
 89
89 -
 90
90 -
 91
91 -
 92
92 -
 93
93 -
 94
94 -
 95
95 -
 96
96 -
 97
97 -
 98
98 -
 99
99 -
 100
100 -
 101
101 -
 102
102 -
 103
103 -
104
-
105
-
106
-
107
-
108
-
109
-
110
-
111
-
112
-
113
-
114
-
115
-
116
-
117
-
118
-
119
-
120
-
121
-
122
-
123
-
124
-
125
-
126
-
127
-
128
-
129
-
130
-
131
-
132
-
133
-
134
-
135
-
136
-
137
-
138
-
139
-
140
-
141
-
142
-
143
-
144
-
145
-
146
-
147
 |
 |

Medtronic, Inc.
Notes to Consolidated Financial Statements (Continued)
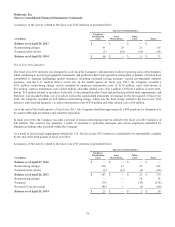
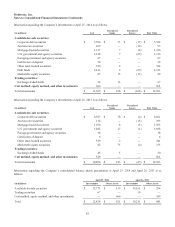
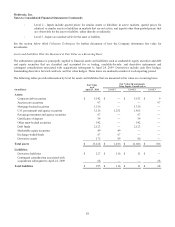
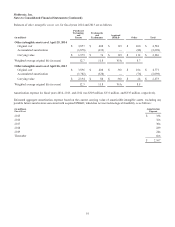
Information regarding the Company’s investments at April 25, 2014 is as follows:
(in millions) Cost
Unrealized
Gains
Unrealized
Losses Fair Value
Available-for-sale securities:
Corporate debt securities $ 5,504 $ 55 $ (17) $ 5,542
Auction rate securities 109 — (12) 97
Mortgage-backed securities 1,337 7 (8) 1,336
U.S. government and agency securities 3,138 7 (29) 3,116
Foreign government and agency securities 67——67
Certificates of deposit 54——54
Other asset-backed securities 540 2 — 542
Debt funds 2,143 9 (29) 2,123
Marketable equity securities 47 15 (13) 49
Trading securities:
Exchange-traded funds 54 13 — 67
Cost method, equity method, and other investments 666 — — NA
Total investments $ 13,659 $ 108 $ (108) $ 12,993
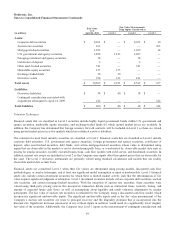
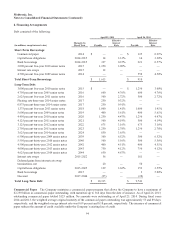
Information regarding the Company’s investments at April 26, 2013 is as follows:
(in millions) Cost
Unrealized
Gains
Unrealized
Losses Fair Value
Available-for-sale securities:
Corporate debt securities $ 4,587 $ 78 $ (4) $ 4,661
Auction rate securities 118 — (15) 103
Mortgage-backed securities 1,050 8 (5) 1,053
U.S. government and agency securities 3,882 17 (1) 3,898
Foreign government and agency securities 38——38
Certificates of deposit 6 — — 6
Other asset-backed securities 539 2 — 541
Marketable equity securities 82 75 (2) 155
Trading securities:
Exchange-traded funds 45 5 — 50
Cost method, equity method, and other investments 549 — — NA
Total investments $ 10,896 $ 185 $ (27) $ 10,505
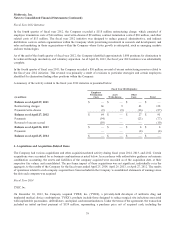
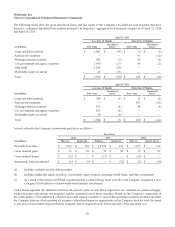
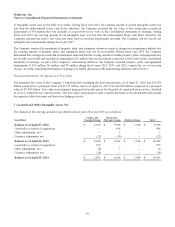
Information regarding the Company’s consolidated balance sheets presentation at April 25, 2014 and April 26, 2013 is as
follows:
April 25, 2014 April 26, 2013
(in millions) Investments Other Assets Investments Other Assets
Available-for-sale securities $ 12,771 $ 155 $ 10,161 $ 294
Trading securities 67 — 50 —
Cost method, equity method, and other investments — 666 — 549
Total $ 12,838 $ 821 $ 10,211 $ 843
85