Medtronic 2014 Annual Report Download - page 122
Download and view the complete annual report
Please find page 122 of the 2014 Medtronic annual report below. You can navigate through the pages in the report by either clicking on the pages listed below, or by using the keyword search tool below to find specific information within the annual report.-
 1
1 -
2
-
3
-
4
-
5
-
6
-
7
-
8
-
9
-
10
-
11
-
12
-
13
-
14
-
15
-
16
-
17
-
18
-
19
-
20
-
21
-
22
-
23
-
24
-
25
-
26
-
27
-
28
-
29
-
30
-
31
-
32
-
33
-
34
-
35
-
36
-
37
-
38
-
39
-
40
-
41
-
42
-
43
-
44
-
45
-
46
-
47
-
48
-
49
-
50
-
51
-
52
-
53
-
54
-
55
-
56
-
57
-
58
-
59
-
60
-
61
-
62
-
63
-
64
-
65
-
66
-
67
-
68
-
69
-
70
-
71
-
72
-
73
-
74
-
75
-
76
-
77
-
78
-
79
-
80
-
81
-
82
-
83
-
84
-
85
-
86
-
87
-
88
-
89
-
90
-
91
-
92
-
93
-
94
-
95
-
96
-
97
-
98
-
99
-
100
-
101
-
102
-
103
-
104
-
105
-
106
-
107
-
108
-
109
-
110
-
111
-
 112
112 -
 113
113 -
 114
114 -
 115
115 -
 116
116 -
 117
117 -
 118
118 -
 119
119 -
 120
120 -
 121
121 -
 122
122 -
 123
123 -
 124
124 -
 125
125 -
 126
126 -
 127
127 -
 128
128 -
 129
129 -
 130
130 -
 131
131 -
 132
132 -
133
-
134
-
135
-
136
-
137
-
138
-
139
-
140
-
141
-
142
-
143
-
144
-
145
-
146
-
147
 |
 |

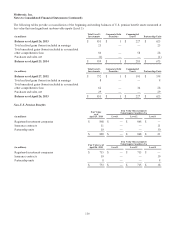
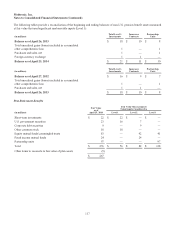
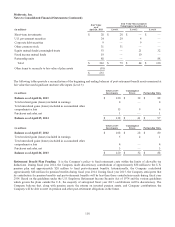
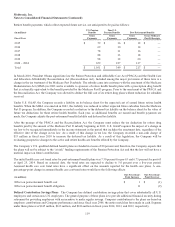
Medtronic, Inc.
Notes to Consolidated Financial Statements (Continued)
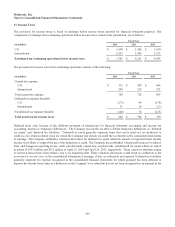
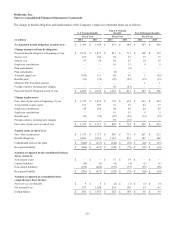
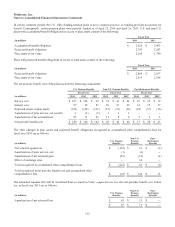
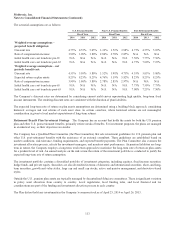
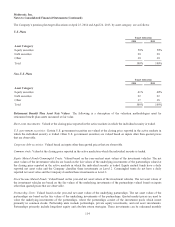
The Company’s pension plan target allocations at April 25, 2014 and April 26, 2013, by asset category, are as follows:
U.S. Plans
Target Allocation
2014 2013
Asset Category
Equity securities 50% 50%
Debt securities 20 20
Other 30 30
Total 100% 100%
Non-U.S. Plans
Target Allocation
2014 2013
Asset Category
Equity securities 41% 40%
Debt securities 22 22
Other 37 38
Total 100% 100%
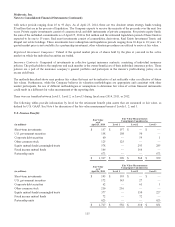
Retirement Benefit Plan Asset Fair Values The following is a description of the valuation methodologies used for
retirement benefit plan assets measured at fair value.
Short-term investments: Valued at the closing price reported in the active markets in which the individual security is traded.
U.S. government securities: Certain U.S. government securities are valued at the closing price reported in the active markets in
which the individual security is traded. Other U.S. government securities are valued based on inputs other than quoted prices
that are observable.
Corporate debt securities: Valued based on inputs other than quoted prices that are observable.
Common stock: Valued at the closing price reported in the active markets in which the individual security is traded.
Equity Mutual Funds/Commingled Trusts: Valued based on the year-end net asset values of the investment vehicles. The net
asset values of the investment vehicles are based on the fair values of the underlying investments of the partnerships valued at
the closing price reported in the active markets in which the individual security is traded. Equity mutual funds have a daily
reported net asset value and the Company classifies these investments as Level 2. Commingled trusts do not have a daily
reported net asset value and the Company classifies these investments as Level 3.
Fixed Income Mutual Funds: Valued based on the year-end net asset values of the investment vehicles. The net asset values of
the investment vehicles are based on the fair values of the underlying investments of the partnerships valued based on inputs
other than quoted prices that are observable.
Partnership Units: Valued based on the year-end net asset values of the underlying partnerships. The net asset values of the
partnerships are based on the fair values of the underlying investments of the partnerships. Quoted market prices are used to
value the underlying investments of the partnerships, where the partnerships consist of the investment pools which invest
primarily in common stocks. Partnership units include partnerships, private equity investments, and real asset investments.
Partnerships primarily include long/short equity and absolute return strategies. These investments can be redeemed monthly
114