Medtronic 2014 Annual Report Download - page 126
Download and view the complete annual report
Please find page 126 of the 2014 Medtronic annual report below. You can navigate through the pages in the report by either clicking on the pages listed below, or by using the keyword search tool below to find specific information within the annual report.-
 1
1 -
2
-
3
-
4
-
5
-
6
-
7
-
8
-
9
-
10
-
11
-
12
-
13
-
14
-
15
-
16
-
17
-
18
-
19
-
20
-
21
-
22
-
23
-
24
-
25
-
26
-
27
-
28
-
29
-
30
-
31
-
32
-
33
-
34
-
35
-
36
-
37
-
38
-
39
-
40
-
41
-
42
-
43
-
44
-
45
-
46
-
47
-
48
-
49
-
50
-
51
-
52
-
53
-
54
-
55
-
56
-
57
-
58
-
59
-
60
-
61
-
62
-
63
-
64
-
65
-
66
-
67
-
68
-
69
-
70
-
71
-
72
-
73
-
74
-
75
-
76
-
77
-
78
-
79
-
80
-
81
-
82
-
83
-
84
-
85
-
86
-
87
-
88
-
89
-
90
-
91
-
92
-
93
-
94
-
95
-
96
-
97
-
98
-
99
-
100
-
101
-
102
-
103
-
104
-
105
-
106
-
107
-
108
-
109
-
110
-
111
-
112
-
113
-
114
-
115
-
 116
116 -
 117
117 -
 118
118 -
 119
119 -
 120
120 -
 121
121 -
 122
122 -
 123
123 -
 124
124 -
 125
125 -
 126
126 -
 127
127 -
 128
128 -
 129
129 -
 130
130 -
 131
131 -
 132
132 -
 133
133 -
 134
134 -
 135
135 -
 136
136 -
137
-
138
-
139
-
140
-
141
-
142
-
143
-
144
-
145
-
146
-
147
 |
 |

Medtronic, Inc.
Notes to Consolidated Financial Statements (Continued)
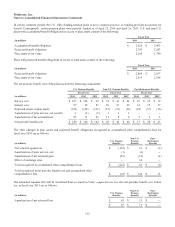
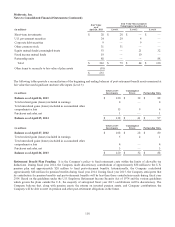
Fair Value
as of
April 26, 2013
Fair Value Measurements
Using Inputs Considered as
(in millions) Level 1 Level 2 Level 3
Short-term investments $ 28 $ 28 $ — $ —
U.S. government securities 24 20 4 —
Corporate debt securities 9 — 9 —
Other common stock 31 31 — —
Equity mutual funds/commingled trusts 53 — 21 32
Fixed income mutual funds 10 — 10 —
Partnership units 88——88
Total $ 243 $ 79 $ 44 $ 120
Other items to reconcile to fair value of plan assets (10)
$ 233
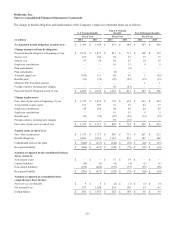
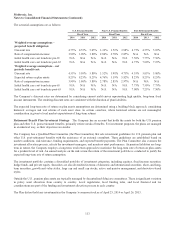
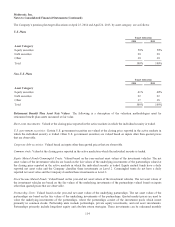
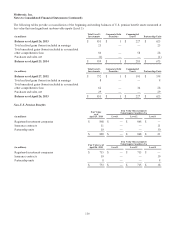
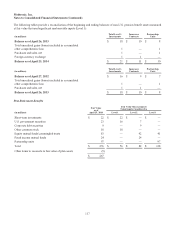
The following tables provide a reconciliation of the beginning and ending balances of post-retirement benefit assets measured at
fair value that used significant unobservable inputs (Level 3):
(in millions)
Total Level 3
Investments
Commingled
Trusts Partnership Units
Balance as of April 26, 2013 $ 120 $ 32 $ 88
Total realized gains (losses) included in earnings 4 — 4
Total unrealized gains (losses) included in accumulated other
comprehensive loss 13 9 4
Purchases and sales, net 1 — 1
Balance as of April 25, 2014 $ 138 $ 41 $ 97
(in millions)
Total Level 3
Investments
Commingled
Trusts Partnership Units
Balance as of April 27, 2012 $ 108 $ 28 $ 80
Total realized gains (losses) included in earnings 5 4 1
Total unrealized gains (losses) included in accumulated other
comprehensive loss 4 — 4
Purchases and sales, net 3 — 3
Balance as of April 26, 2013 $ 120 $ 32 $ 88
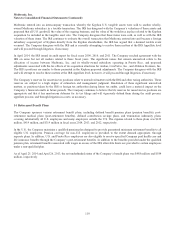
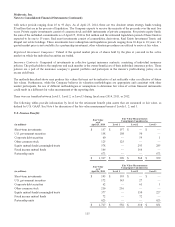
Retirement Benefit Plan Funding It is the Company’s policy to fund retirement costs within the limits of allowable tax
deductions. During fiscal year 2014, the Company made discretionary contributions of approximately $88 million to the U.S.
pension plan and approximately $20 million to fund post-retirement benefits. Internationally, the Company contributed
approximately $48 million for pension benefits during fiscal year 2014. During fiscal year 2015, the Company anticipates that
its contribution for pension benefits and post-retirement benefits will be less than those contributions made during fiscal year
2014. Based on the guidelines under the U.S. Employee Retirement Income Security Act of 1974 and the various guidelines
which govern the plans outside the U.S., the majority of anticipated fiscal year 2015 contributions will be discretionary. The
Company believes that, along with pension assets, the returns on invested pension assets, and Company contributions, the
Company will be able to meet its pension and other post-retirement obligations in the future.
118