Medtronic 2014 Annual Report Download - page 123
Download and view the complete annual report
Please find page 123 of the 2014 Medtronic annual report below. You can navigate through the pages in the report by either clicking on the pages listed below, or by using the keyword search tool below to find specific information within the annual report.-
 1
1 -
2
-
3
-
4
-
5
-
6
-
7
-
8
-
9
-
10
-
11
-
12
-
13
-
14
-
15
-
16
-
17
-
18
-
19
-
20
-
21
-
22
-
23
-
24
-
25
-
26
-
27
-
28
-
29
-
30
-
31
-
32
-
33
-
34
-
35
-
36
-
37
-
38
-
39
-
40
-
41
-
42
-
43
-
44
-
45
-
46
-
47
-
48
-
49
-
50
-
51
-
52
-
53
-
54
-
55
-
56
-
57
-
58
-
59
-
60
-
61
-
62
-
63
-
64
-
65
-
66
-
67
-
68
-
69
-
70
-
71
-
72
-
73
-
74
-
75
-
76
-
77
-
78
-
79
-
80
-
81
-
82
-
83
-
84
-
85
-
86
-
87
-
88
-
89
-
90
-
91
-
92
-
93
-
94
-
95
-
96
-
97
-
98
-
99
-
100
-
101
-
102
-
103
-
104
-
105
-
106
-
107
-
108
-
109
-
110
-
111
-
112
-
 113
113 -
 114
114 -
 115
115 -
 116
116 -
 117
117 -
 118
118 -
 119
119 -
 120
120 -
 121
121 -
 122
122 -
 123
123 -
 124
124 -
 125
125 -
 126
126 -
 127
127 -
 128
128 -
 129
129 -
 130
130 -
 131
131 -
 132
132 -
 133
133 -
134
-
135
-
136
-
137
-
138
-
139
-
140
-
141
-
142
-
143
-
144
-
145
-
146
-
147
 |
 |

Medtronic, Inc.
Notes to Consolidated Financial Statements (Continued)
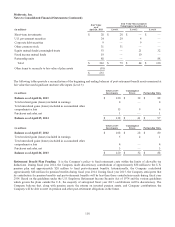
with notice periods ranging from 45 to 95 days. As of April 25, 2014, there are two absolute return strategy funds totaling
$5 million that are in the process of liquidation. The Company expects to receive the majority of the proceeds over the next five
years. Private equity investments consist of common stock and debt instruments of private companies. For private equity funds,
the sum of the unfunded commitments as of April 25, 2014 is $64 million and the estimated liquidation period of these funds is
expected to be one to 15 years. Real asset investments consist of commodities, derivatives, Real Estate Investment Trusts, and
illiquid real estate holdings. These investments have redemption and liquidation periods ranging from 30 days to 10 years. If a
quoted market price is not available for a partnership investment, other valuation procedures are utilized to arrive at fair value.
Registered Investment Companies: Valued at the quoted market prices of shares held by the plan at year-end in the active
market on which the individual securities are traded.
Insurance Contracts: Comprised of investments in collective (group) insurance contracts, consisting of individual insurance
policies. The policyholder is the employer and each member is the owner/beneficiary of their individual insurance policy. These
policies are a part of the insurance company’s general portfolio and participate in the insurer’s profit-sharing policy on an
excess yield basis.
The methods described above may produce fair values that may not be indicative of net realizable value or reflective of future
fair values. Furthermore, while the Company believes its valuation methodologies are appropriate and consistent with other
market participants, the use of different methodologies or assumptions to determine fair value of certain financial instruments
could result in a different fair value measurement at the reporting date.
There were no transfers between Level 1, Level 2, or Level 3 during fiscal years 2014, 2013, or 2012.
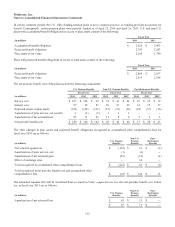
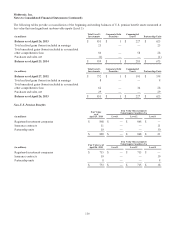
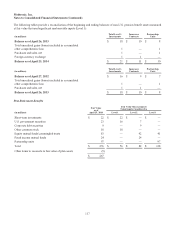
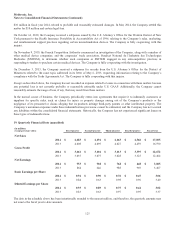
The following tables provide information by level for the retirement benefit plan assets that are measured at fair value, as
defined by U.S. GAAP. See Note 6 for discussion of the fair value measurement terms of Levels 1, 2, and 3.
U.S. Pension Benefits
Fair Value
as of
April 25, 2014
Fair Value Measurements
Using Inputs Considered as
(in millions) Level 1 Level 2 Level 3
Short-term investments $ 157 $ 157 $ — $ —
U.S. government securities 158 108 50 —
Corporate debt securities 60 — 59 1
Other common stock 125 125 — —
Equity mutual funds/commingled trusts 578 — 293 285
Fixed income mutual funds 166 — 166 —
Partnership units 673 — — 673
$ 1,917 $ 390 $ 568 $ 959
Fair Value
as of
April 26, 2013
Fair Value Measurements
Using Inputs Considered as
(in millions) Level 1 Level 2 Level 3
Short-term investments $ 195 $ 195 $ — $ —
U.S. government securities 172 145 27 —
Corporate debt securities 62 — 61 1
Other common stock 216 216 — —
Equity mutual funds/commingled trusts 377 — 150 227
Fixed income mutual funds 72 — 72 —
Partnership units 623 — — 623
$ 1,717 $ 556 $ 310 $ 851
115