Medtronic 2014 Annual Report Download - page 109
Download and view the complete annual report
Please find page 109 of the 2014 Medtronic annual report below. You can navigate through the pages in the report by either clicking on the pages listed below, or by using the keyword search tool below to find specific information within the annual report.-
 1
1 -
2
-
3
-
4
-
5
-
6
-
7
-
8
-
9
-
10
-
11
-
12
-
13
-
14
-
15
-
16
-
17
-
18
-
19
-
20
-
21
-
22
-
23
-
24
-
25
-
26
-
27
-
28
-
29
-
30
-
31
-
32
-
33
-
34
-
35
-
36
-
37
-
38
-
39
-
40
-
41
-
42
-
43
-
44
-
45
-
46
-
47
-
48
-
49
-
50
-
51
-
52
-
53
-
54
-
55
-
56
-
57
-
58
-
59
-
60
-
61
-
62
-
63
-
64
-
65
-
66
-
67
-
68
-
69
-
70
-
71
-
72
-
73
-
74
-
75
-
76
-
77
-
78
-
79
-
80
-
81
-
82
-
83
-
84
-
85
-
86
-
87
-
88
-
89
-
90
-
91
-
92
-
93
-
94
-
95
-
96
-
97
-
98
-
 99
99 -
 100
100 -
 101
101 -
 102
102 -
 103
103 -
 104
104 -
 105
105 -
 106
106 -
 107
107 -
 108
108 -
 109
109 -
 110
110 -
 111
111 -
 112
112 -
 113
113 -
 114
114 -
 115
115 -
 116
116 -
 117
117 -
 118
118 -
 119
119 -
120
-
121
-
122
-
123
-
124
-
125
-
126
-
127
-
128
-
129
-
130
-
131
-
132
-
133
-
134
-
135
-
136
-
137
-
138
-
139
-
140
-
141
-
142
-
143
-
144
-
145
-
146
-
147
 |
 |

Medtronic, Inc.
Notes to Consolidated Financial Statements (Continued)
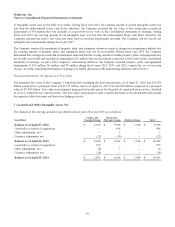
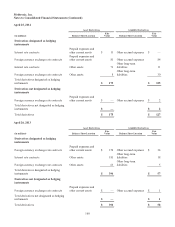
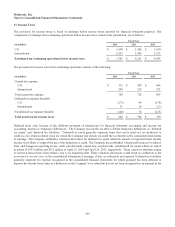
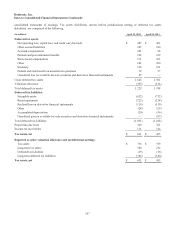
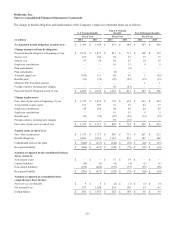
The Company has elected to present the fair value of derivative assets and liabilities within the consolidated balance sheets on a
gross basis even when derivative transactions are subject to master netting arrangements and may otherwise qualify for net
presentation. The following table provides information as if the Company had elected to offset the asset and liability balances of
derivative instruments, netted in accordance with various criteria as stipulated by the terms of the master netting arrangements
with each of the counterparties. Derivatives not subject to master netting arrangements are not eligible for net presentation.
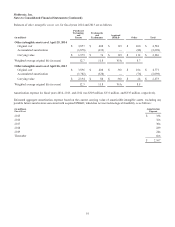
April 25, 2014 Gross Amount Not Offset on the
Balance Sheet
(in millions)
Gross Amount of
Recognized Assets
(Liabilities)
Financial
Instruments
Cash Collateral
(Received) or
Posted Net Amount
Derivative Assets
Foreign currency exchange rate contracts $ 89 $ (64) $ — $ 25
Interest rate contracts 86 (31) — 55
$ 175 $ (95) $ — $ 80
Derivative Liabilities
Foreign currency exchange rate contracts $ (116) $ 84 $ — $ (32)
Interest rate contracts (11) 11 — —
$ (127) $ 95 $ — $ (32)
Total $ 48$ —$ —$ 48
April 26, 2013 Gross Amount Not Offset on the
Balance Sheet
(in millions)
Gross Amount of
Recognized Assets
(Liabilities)
Financial
Instruments
Cash Collateral
(Received) or
Posted Net Amount
Derivative Assets
Foreign currency exchange rate contracts $ 213 $ (42) $ (24) $ 147
Interest rate contracts 181 (16) (6) 159
$ 394 $ (58) $ (30) $ 306
Derivative Liabilities
Foreign currency exchange rate contracts $ (40) $ 40 $ — $ —
Interest rate contracts (18) 18 — —
$ (58) $ 58 $ — $ —
Total $ 336 $ — $ (30) $ 306
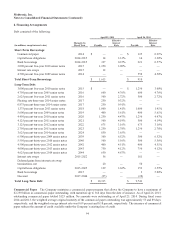
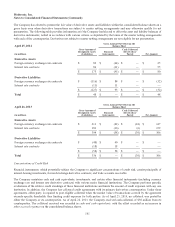
Concentrations of Credit Risk
Financial instruments, which potentially subject the Company to significant concentrations of credit risk, consist principally of
interest-bearing investments, forward exchange derivative contracts, and trade accounts receivable.
The Company maintains cash and cash equivalents, investments, and certain other financial instruments (including currency
exchange rate and interest rate derivative contracts) with various major financial institutions. The Company performs periodic
evaluations of the relative credit standings of these financial institutions and limits the amount of credit exposure with any one
institution. In addition, the Company has collateral credit agreements with its primary derivatives counterparties. Under these
agreements, either party is required to post eligible collateral when the market value of transactions covered by the agreement
exceeds specific thresholds, thus limiting credit exposure for both parties. As of April 25, 2014, no collateral was posted by
either the Company or its counterparties. As of April 26, 2013, the Company received cash collateral of $30 million from its
counterparties. The collateral received was recorded in cash and cash equivalents, with the offset recorded as an increase in
other accrued expenses on the consolidated balance sheets.
101