Medtronic 2014 Annual Report Download - page 55
Download and view the complete annual report
Please find page 55 of the 2014 Medtronic annual report below. You can navigate through the pages in the report by either clicking on the pages listed below, or by using the keyword search tool below to find specific information within the annual report.-
 1
1 -
2
-
3
-
4
-
5
-
6
-
7
-
8
-
9
-
10
-
11
-
12
-
13
-
14
-
15
-
16
-
17
-
18
-
19
-
20
-
21
-
22
-
23
-
24
-
25
-
26
-
27
-
28
-
29
-
30
-
31
-
32
-
33
-
34
-
35
-
36
-
37
-
38
-
39
-
40
-
41
-
42
-
43
-
44
-
 45
45 -
 46
46 -
 47
47 -
 48
48 -
 49
49 -
 50
50 -
 51
51 -
 52
52 -
 53
53 -
 54
54 -
 55
55 -
 56
56 -
 57
57 -
 58
58 -
 59
59 -
 60
60 -
 61
61 -
 62
62 -
 63
63 -
 64
64 -
 65
65 -
66
-
67
-
68
-
69
-
70
-
71
-
72
-
73
-
74
-
75
-
76
-
77
-
78
-
79
-
80
-
81
-
82
-
83
-
84
-
85
-
86
-
87
-
88
-
89
-
90
-
91
-
92
-
93
-
94
-
95
-
96
-
97
-
98
-
99
-
100
-
101
-
102
-
103
-
104
-
105
-
106
-
107
-
108
-
109
-
110
-
111
-
112
-
113
-
114
-
115
-
116
-
117
-
118
-
119
-
120
-
121
-
122
-
123
-
124
-
125
-
126
-
127
-
128
-
129
-
130
-
131
-
132
-
133
-
134
-
135
-
136
-
137
-
138
-
139
-
140
-
141
-
142
-
143
-
144
-
145
-
146
-
147
 |
 |

•Continued acceptance from both physicians and patients of insulin-pump and CGM therapy.
•Continued and future growth of the MiniMed 530G System, available in the U.S., which includes the insulin
pump and Enlite sensor. This is the first system in the U.S. that assists in protecting against the risk of
hypoglycemia by automatically suspending insulin delivery when glucose falls below a specified threshold.
•We are working with the U.S. FDA to address its questions on the Diabetes quality system, included in its
September 2013 warning letter. This warning letter may limit our ability to launch certain new diabetes
products in the U.S. until it is resolved.
•Acceptance and future growth from our next-generation pump system the MiniMed 640G. In the first half of
fiscal year 2015, we expect to launch the MiniMed 640G pump system in certain international markets.
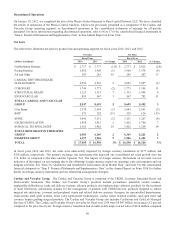
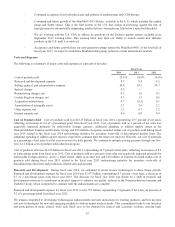
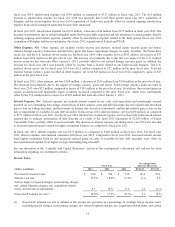
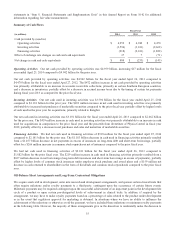
Costs and Expenses
The following is a summary of major costs and expenses as a percent of net sales:
Fiscal Year
2014 2013 2012
Cost of products sold 25.5% 24.9% 24.0%
Research and development expense 8.7 9.4 9.2
Selling, general, and administrative expense 34.4 34.3 34.7
Special charges 0.2 — —
Restructuring charges, net 0.5 1.0 0.5
Certain litigation charges, net 4.5 1.5 0.6
Acquisition-related items 0.7 (0.3) 0.1
Amortization of intangible assets 2.1 2.0 2.1
Other expense, net 1.1 0.7 2.2
Interest expense, net 0.6 0.9 0.9
Cost of Products Sold Cost of products sold was $4.333 billion in fiscal year 2014, representing 25.5 percent of net sales,
reflecting an increase of 0.6 of a percentage point from fiscal year 2013. Cost of products sold as a percent of net sales was
negatively impacted primarily by unfavorable foreign currency, additional spending to address quality issues in the
Neuromodulation business and Diabetes Group, and $10 million of expense recorded within cost of products sold during fiscal
year 2014 related to the fiscal year 2014 restructuring initiative for inventory write-offs of discontinued product lines. The
additional spending to address quality issues is expected to continue until the issues are resolved. However, our cost of materials
as a percentage of net sales was flat year-over-year for both periods. We continue to mitigate pricing pressure through our five-
year, $1.2 billion cost of products sold reduction program.
Cost of products sold was $4.126 billion in fiscal year 2013, representing 24.9 percent of net sales, reflecting an increase of 0.9
of a percentage point from fiscal year 2012. Cost of products sold as a percent of net sales was negatively impacted primarily by
unfavorable foreign currency, and to a lesser extent, shifts in product mix and $10 million of expense recorded within cost of
products sold during fiscal year 2013 related to the fiscal year 2013 restructuring initiative for inventory write-offs of
discontinued product lines and production-related asset impairments.
Research and Development During fiscal year 2014, we continued to invest in new technologies to drive future growth.
Research and development expense for fiscal year 2014 was $1.477 billion, representing 8.7 percent of net sales, a decrease of
0.7 of a percentage point from fiscal year 2013. The decrease for fiscal year 2014 was driven by a shift in research and
development resources to investment in product support to enhance our quality systems in the Neuromodulation business and
Diabetes Group, which is expected to continue until the enhancements are complete.
Research and development expense for fiscal year 2013 was $1.557 billion, representing 9.4 percent of net sales, an increase of
0.2 of a percentage point from fiscal year 2012.
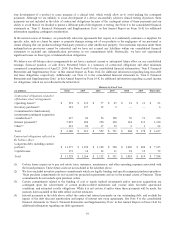
We remain committed to developing technological enhancements and new indications for existing products, and less invasive
and new technologies for new and emerging markets to address unmet medical needs. That commitment leads to our initiation
and participation in many clinical trials each fiscal year as the demand for clinical and economic evidence remains high.
47