Kodak 2014 Annual Report Download - page 98
Download and view the complete annual report
Please find page 98 of the 2014 Kodak annual report below. You can navigate through the pages in the report by either clicking on the pages listed below, or by using the keyword search tool below to find specific information within the annual report.-
 1
1 -
2
-
3
-
4
-
5
-
6
-
7
-
8
-
9
-
10
-
11
-
12
-
13
-
14
-
15
-
16
-
17
-
18
-
19
-
20
-
21
-
22
-
23
-
24
-
25
-
26
-
27
-
28
-
29
-
30
-
31
-
32
-
33
-
34
-
35
-
36
-
37
-
38
-
39
-
40
-
41
-
42
-
43
-
44
-
45
-
46
-
47
-
48
-
49
-
50
-
51
-
52
-
53
-
54
-
55
-
56
-
57
-
58
-
59
-
60
-
61
-
62
-
63
-
64
-
65
-
66
-
67
-
68
-
69
-
70
-
71
-
72
-
73
-
74
-
75
-
76
-
77
-
78
-
79
-
80
-
81
-
82
-
83
-
84
-
85
-
86
-
87
-
 88
88 -
 89
89 -
 90
90 -
 91
91 -
 92
92 -
 93
93 -
 94
94 -
 95
95 -
 96
96 -
 97
97 -
 98
98 -
 99
99 -
 100
100 -
 101
101 -
 102
102 -
 103
103 -
 104
104 -
 105
105 -
 106
106 -
 107
107 -
 108
108 -
109
-
110
-
111
-
112
-
113
-
114
-
115
-
116
-
117
-
118
-
119
-
120
-
121
-
122
-
123
-
124
-
125
-
126
-
127
-
128
-
129
-
130
-
131
-
132
-
133
-
134
-
135
-
136
-
137
-
138
-
139
-
140
-
141
-
142
-
143
-
144
-
145
-
146
-
147
-
148
-
149
-
150
-
151
-
152
-
153
-
154
-
155
-
156
 |
 |

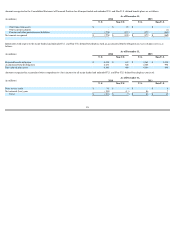
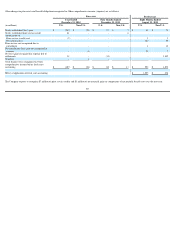
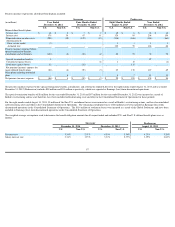
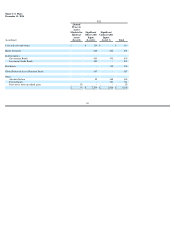
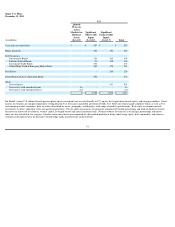
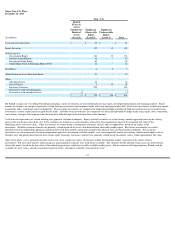
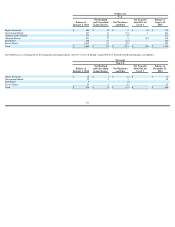
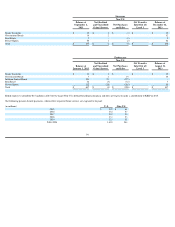
The following is a reconciliation of the beginning and ending balances of level 3 assets of Kodak’s major Non-U.S. defined benefit pension plans (in millions):
Predecessor
U.S.
Balance at
January 1, 2013
Net Realized
and Unrealized
Gains/(Losses)
Net Purchases
and Sales
Net Transfer
Into/(Out of)
Level 3
Balance at
August 31,
2013
Equity Securities
$
163
$
16
$
5
$
(8
)
$
176
Government Bonds
201
17
(15
)
1
204
Inflation
-
Linked Bonds
104
12
(5
)
-
111
Absolute Return
201
27
(5
)
(83
)
140
Real Estate
198
21
(15
)
-
204
Private Equity
1,002
39
(82
)
-
959
Total
$
1,869
$
132
$
(117
)
$
(90
)
$
1,794
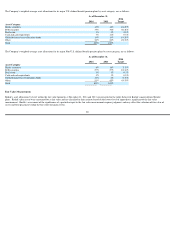
Successor
Non
-
U.S.
Balance at
January 1, 2014
Net Realized
and Unrealized
Gains/(Losses)
Net Purchases
and Sales
Net Transfer
Into/(Out of)
Level 3
Balance at
December 31,
2014
Equity Securities
$
15
$
2
$
(4
)
$
-
$
13
Government Bonds
32
4
2
-
38
Real Estate
5
-
(5
)
-
-
Private Equity
54
9
(8
)
-
55
Total
$
106
$
15
$
(15
)
$
-
$
106
95