Kodak 2014 Annual Report Download - page 25
Download and view the complete annual report
Please find page 25 of the 2014 Kodak annual report below. You can navigate through the pages in the report by either clicking on the pages listed below, or by using the keyword search tool below to find specific information within the annual report.-
 1
1 -
2
-
3
-
4
-
5
-
6
-
7
-
8
-
9
-
10
-
11
-
12
-
13
-
14
-
 15
15 -
 16
16 -
 17
17 -
 18
18 -
 19
19 -
 20
20 -
 21
21 -
 22
22 -
 23
23 -
 24
24 -
 25
25 -
 26
26 -
 27
27 -
 28
28 -
 29
29 -
 30
30 -
 31
31 -
 32
32 -
 33
33 -
 34
34 -
 35
35 -
36
-
37
-
38
-
39
-
40
-
41
-
42
-
43
-
44
-
45
-
46
-
47
-
48
-
49
-
50
-
51
-
52
-
53
-
54
-
55
-
56
-
57
-
58
-
59
-
60
-
61
-
62
-
63
-
64
-
65
-
66
-
67
-
68
-
69
-
70
-
71
-
72
-
73
-
74
-
75
-
76
-
77
-
78
-
79
-
80
-
81
-
82
-
83
-
84
-
85
-
86
-
87
-
88
-
89
-
90
-
91
-
92
-
93
-
94
-
95
-
96
-
97
-
98
-
99
-
100
-
101
-
102
-
103
-
104
-
105
-
106
-
107
-
108
-
109
-
110
-
111
-
112
-
113
-
114
-
115
-
116
-
117
-
118
-
119
-
120
-
121
-
122
-
123
-
124
-
125
-
126
-
127
-
128
-
129
-
130
-
131
-
132
-
133
-
134
-
135
-
136
-
137
-
138
-
139
-
140
-
141
-
142
-
143
-
144
-
145
-
146
-
147
-
148
-
149
-
150
-
151
-
152
-
153
-
154
-
155
-
156
 |
 |

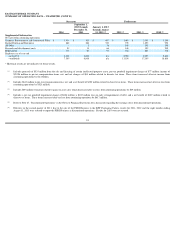
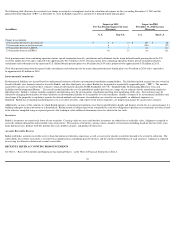
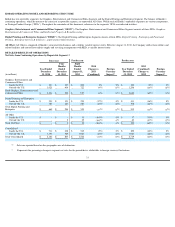
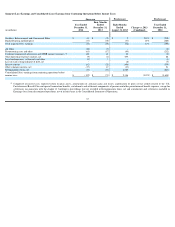
EASTMAN KODAK COMPANY
SUMMARY OF OPERATING DATA – UNAUDITED (CONT’D)
* Historical results are not indicative of future results.
Successor
Predecessor
2014
September 1,
2013 through
December 31,
2013
January 1, 2013
through August
31, 2013
(6)
2012
(6)
2011
(6)
2010
(6)
Supplemental Information
Net sales from continuing operations
Graphics, Entertainment and Commercial Films
$
1,434
$
521
$
987
$
1,680
$
2,341
$
3,290
Digital Printing and Enterprise
668
284
519
939
1,099
950
All Other
-
2
36
100
145
198
Research and development costs
94
33
66
168
195
249
Depreciation
174
67
91
182
221
318
Employees as of year end
-
in the U.S.
3,200
3,600
n/a
5,980
8,350
9,600
-
worldwide
7,300
8,800
n/a
13,100
17,100
18,800
(1)
Includes proceeds of $535 million from the sale and licensing of certain intellectual property assets, pre-
tax goodwill impairment charges of $77 million; income of
$2,026 million in pre-tax reorganization items, net; and net charges of $84 million related to discrete tax items. These items increased after-
tax income from
continuing operations by $2.4 billion.
(2)
Includes $843 million in pre-tax reorganization items, net; and a net benefit of $320 million related to discrete tax items. These items increased net after-
tax loss from
continuing operations by $523 million.
(3)
Includes $69 million of income related to gains on asset sales which decreased after
-
tax loss from continuing operations by $69 million.
(4)
Includes a pre-
tax goodwill impairment charge of $626 million; a $102 million loss on early extinguishment of debt; and a net benefit of $109 million related to
discrete tax items. These items increased after
-
tax loss from continuing operations by $617 million.
(5)
Refer to Note 27,
“
Discontinued Operations
”
in the Notes to Financial Statements for a discussion regarding the earnings (loss) from discontinued operations.
(6)
Effective in the second quarter of 2013, due to the sale of the PI/DI Business to the KPP Purchasing Parties, results for 2011, 2012 and the eight months ending
August 31, 2013 were restated to report the PI/DI Business as discontinued operations. Results for 2010 were not restated.
24