Kodak 2014 Annual Report Download - page 39
Download and view the complete annual report
Please find page 39 of the 2014 Kodak annual report below. You can navigate through the pages in the report by either clicking on the pages listed below, or by using the keyword search tool below to find specific information within the annual report.-
 1
1 -
2
-
3
-
4
-
5
-
6
-
7
-
8
-
9
-
10
-
11
-
12
-
13
-
14
-
15
-
16
-
17
-
18
-
19
-
20
-
21
-
22
-
23
-
24
-
25
-
26
-
27
-
28
-
 29
29 -
 30
30 -
 31
31 -
 32
32 -
 33
33 -
 34
34 -
 35
35 -
 36
36 -
 37
37 -
 38
38 -
 39
39 -
 40
40 -
 41
41 -
 42
42 -
 43
43 -
 44
44 -
 45
45 -
 46
46 -
 47
47 -
 48
48 -
 49
49 -
50
-
51
-
52
-
53
-
54
-
55
-
56
-
57
-
58
-
59
-
60
-
61
-
62
-
63
-
64
-
65
-
66
-
67
-
68
-
69
-
70
-
71
-
72
-
73
-
74
-
75
-
76
-
77
-
78
-
79
-
80
-
81
-
82
-
83
-
84
-
85
-
86
-
87
-
88
-
89
-
90
-
91
-
92
-
93
-
94
-
95
-
96
-
97
-
98
-
99
-
100
-
101
-
102
-
103
-
104
-
105
-
106
-
107
-
108
-
109
-
110
-
111
-
112
-
113
-
114
-
115
-
116
-
117
-
118
-
119
-
120
-
121
-
122
-
123
-
124
-
125
-
126
-
127
-
128
-
129
-
130
-
131
-
132
-
133
-
134
-
135
-
136
-
137
-
138
-
139
-
140
-
141
-
142
-
143
-
144
-
145
-
146
-
147
-
148
-
149
-
150
-
151
-
152
-
153
-
154
-
155
-
156
 |
 |

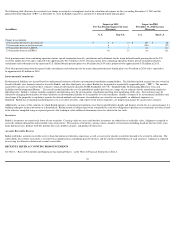
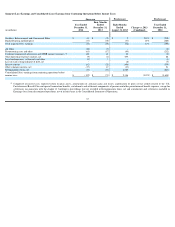
GRAPHICS, ENTERTAINMENT AND COMMERCIAL FILMS
Revenues
Current Year
The decrease in the Graphics, Entertainment and Commercial Films Segment revenues of approximately 5% for the year ended December 31, 2014 reflected volume declines
within Entertainment Imaging & Commercial Films driven by reduced demand for motion picture products (-9%) which was partially offset by increased revenues from third
party manufacturing services performed under supply agreements with Kodak Alaris (+3%). Higher revenues within Intellectual Property and Brand Licensing (+2%) were
partially offset by unfavorable price/mix within Graphics (-2%), largely attributable to pricing pressures in the industry.
Included in revenues were non-recurring intellectual property licensing agreements. Such agreements contributed approximately $70 million to revenues in 2014 and $40
million in 2013.
Successor
Predecessor
Predecessor
(in millions)
Year Ended
December
31, 2014
% of Sales
Four
Months
Ended
December
31,
2013
Eight
Months
Ended
August 31,
2013
% of Sales
(Combined)
2014
Change vs.
2013
(Combined)
Year Ended
December
31, 2012
% of Sales
2013
(Combined)
Change vs.
2012
Net sales
$
1,434
$
521
$
987
(5
%)
$
1,680
(10
%)
Cost of sales
1,192
472
805
(7
%)
1,509
(15
%)
Gross profit
242
17
%
49
182
15
%
5
%
171
10
%
35
%
Selling, general
and
administrative
expenses
190
13
%
77
164
16
%
(21
%)
341
20
%
(29
%)
Research and
development
costs
21
1
%
7
13
1
%
5
%
40
2
%
(50
%)
Segment
earnings (loss)
$
31
2
%
$
(35
)
$
5
(2
%)
203
%
$
(210
)
(13
%)
(86
%)
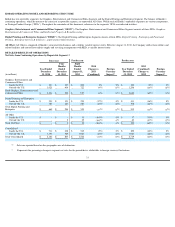
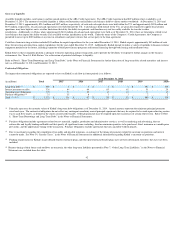
Year Ended December 31,
Percent Change vs. 2013 (Combined)
(in millions)
2014
(Successor)
Change vs. 2013
(Combined)
Volume
Price/Mix
Foreign
Exchange
Manufacturing
and Other
Costs
Net Sales
$
1,434
-
5
%
-
5
%
1
%
-
1
%
n/a
Gross profit margin
17
%
2pp
n/a
0pp
0pp
2pp
Year Ended December 31,
Percent Change vs. 2012
(in millions)
2013
(Combined)
Change vs. 2012
(Predecessor)
Volume
Price/Mix
Foreign
Exchange
Manufacturing
and Other
Costs
Net Sales
$
1,508
-
10
%
-
16
%
7
%
-
1
%
n/a
Gross profit margin
15
%
5pp
n/a
6pp
-
1pp
0pp
38