Kodak 2014 Annual Report Download - page 43
Download and view the complete annual report
Please find page 43 of the 2014 Kodak annual report below. You can navigate through the pages in the report by either clicking on the pages listed below, or by using the keyword search tool below to find specific information within the annual report.-
 1
1 -
2
-
3
-
4
-
5
-
6
-
7
-
8
-
9
-
10
-
11
-
12
-
13
-
14
-
15
-
16
-
17
-
18
-
19
-
20
-
21
-
22
-
23
-
24
-
25
-
26
-
27
-
28
-
29
-
30
-
31
-
32
-
 33
33 -
 34
34 -
 35
35 -
 36
36 -
 37
37 -
 38
38 -
 39
39 -
 40
40 -
 41
41 -
 42
42 -
 43
43 -
 44
44 -
 45
45 -
 46
46 -
 47
47 -
 48
48 -
 49
49 -
 50
50 -
 51
51 -
 52
52 -
 53
53 -
54
-
55
-
56
-
57
-
58
-
59
-
60
-
61
-
62
-
63
-
64
-
65
-
66
-
67
-
68
-
69
-
70
-
71
-
72
-
73
-
74
-
75
-
76
-
77
-
78
-
79
-
80
-
81
-
82
-
83
-
84
-
85
-
86
-
87
-
88
-
89
-
90
-
91
-
92
-
93
-
94
-
95
-
96
-
97
-
98
-
99
-
100
-
101
-
102
-
103
-
104
-
105
-
106
-
107
-
108
-
109
-
110
-
111
-
112
-
113
-
114
-
115
-
116
-
117
-
118
-
119
-
120
-
121
-
122
-
123
-
124
-
125
-
126
-
127
-
128
-
129
-
130
-
131
-
132
-
133
-
134
-
135
-
136
-
137
-
138
-
139
-
140
-
141
-
142
-
143
-
144
-
145
-
146
-
147
-
148
-
149
-
150
-
151
-
152
-
153
-
154
-
155
-
156
 |
 |
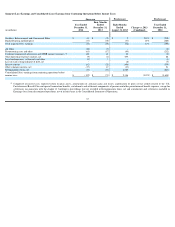
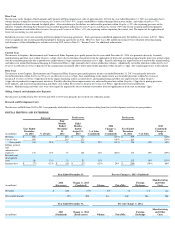
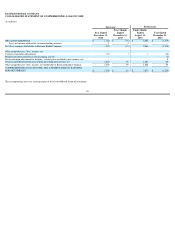
LIQUIDITY AND CAPITAL RESOURCES
2014
Cash Flow Activity
Operating Activities
Net cash used in operating activities improved by $539 million for the year ended December 31, 2014 as compared with the prior year primarily due to improved earnings
impacting cash flow from operations, reflecting higher intellectual property licensing income, lower payments associated with the reorganization and lower interest
payments. Higher interest payments in 2013 were due to payments made in that year for interest accrued but unpaid in 2012, higher outstanding debt balances and higher
average interest rates prior to emergence. The improvements in cash flow from operations were partially offset by the $49 million funding of the Eastman Business Park Trust
in the current year.
Investing Activities
Net cash provided by investing activities decreased $719 million for the year ended December 31, 2014 as compared with the prior year primarily due to the $820 million
of proceeds from the 2013 sales of the digital imaging patent portfolio and the Personalized Imaging and Document Imaging businesses partially offset by the release of
restricted cash accounts funded in 2013.
Financing Activities
Net cash used in financing activities decreased $359 million for the year ended December 31, 2014 as compared with the prior year due to the $811 million net pay
-down of
debt in 2013, partially offset by the $406 million proceeds from the rights offering and the $35 million contingent cash received with the sale of the Personalized Imaging and
Document Imaging businesses.
As of December 31,
(in millions)
2014
2013
Cash and cash equivalents
$
712
$
844
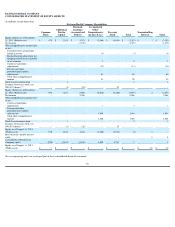
(in millions)
Successor
Predecessor
Year Ended
December 31,
2014
Four Months
Ended
December 31,
2013
Eight Months
Ended
August 31,
2013
Computed
Change vs 2013
(Combined)
Cash flows from operating activities:
Net cash used in operating activities
$
(128
)
$
(102
)
$
(565
)
$
539
Cash flows from investing activities:
Net cash provided by investing activities
41
81
679
(719
)
Cash flows from financing activities:
Net cash used in financing activities
(7
)
(38
)
(328
)
359
Effect of exchange rate changes on cash
(38
)
5
(23
)
(20
)
Net (decrease) increase in cash and cash equivalents
$
(132
)
$
(54
)
$
(237
)
$
159
41