Kodak 2014 Annual Report Download - page 24
Download and view the complete annual report
Please find page 24 of the 2014 Kodak annual report below. You can navigate through the pages in the report by either clicking on the pages listed below, or by using the keyword search tool below to find specific information within the annual report.-
 1
1 -
2
-
3
-
4
-
5
-
6
-
7
-
8
-
9
-
10
-
11
-
12
-
13
-
 14
14 -
 15
15 -
 16
16 -
 17
17 -
 18
18 -
 19
19 -
 20
20 -
 21
21 -
 22
22 -
 23
23 -
 24
24 -
 25
25 -
 26
26 -
 27
27 -
 28
28 -
 29
29 -
 30
30 -
 31
31 -
 32
32 -
 33
33 -
 34
34 -
35
-
36
-
37
-
38
-
39
-
40
-
41
-
42
-
43
-
44
-
45
-
46
-
47
-
48
-
49
-
50
-
51
-
52
-
53
-
54
-
55
-
56
-
57
-
58
-
59
-
60
-
61
-
62
-
63
-
64
-
65
-
66
-
67
-
68
-
69
-
70
-
71
-
72
-
73
-
74
-
75
-
76
-
77
-
78
-
79
-
80
-
81
-
82
-
83
-
84
-
85
-
86
-
87
-
88
-
89
-
90
-
91
-
92
-
93
-
94
-
95
-
96
-
97
-
98
-
99
-
100
-
101
-
102
-
103
-
104
-
105
-
106
-
107
-
108
-
109
-
110
-
111
-
112
-
113
-
114
-
115
-
116
-
117
-
118
-
119
-
120
-
121
-
122
-
123
-
124
-
125
-
126
-
127
-
128
-
129
-
130
-
131
-
132
-
133
-
134
-
135
-
136
-
137
-
138
-
139
-
140
-
141
-
142
-
143
-
144
-
145
-
146
-
147
-
148
-
149
-
150
-
151
-
152
-
153
-
154
-
155
-
156
 |
 |

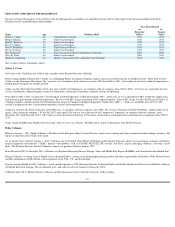
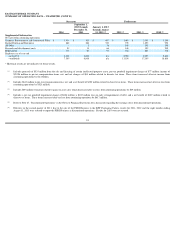
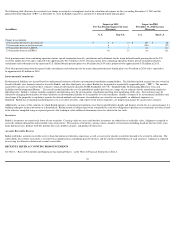
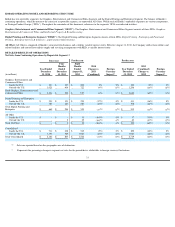
ITEM 6. SELECTED FINANCIAL DATA
EASTMAN KODAK COMPANY
SUMMARY OF OPERATING DATA – UNAUDITED
Successor
Predecessor
(in millions, except per share data,
shareholders, and employees )
2014
September 1,
2013
through
December 31,
2013
January 1,
2013 through
August 31,
2013
(6)
2012
(6)
2011
(6)
2010
(6)
Net sales from continuing operations
$
2,102
$
807
$
1,542
$
2,719
$
3,585
$
4,438
Loss (earnings) from continuing operations
before interest expense, loss on extinguishment
of debt, other income (charges), net,
reorganization items, net, and income taxes
(16
)
(46
)
457
(642
)
(616
)
(263
)
Loss (earnings) from:
Continuing operations
(122
)
(82
)
2,201
(1,337
)
(739
)
(560
)
Discontinued operations
(5)
4
4
(135
)
(42
)
(25
)
(128
)
Net (Loss) earnings
(118
)
(78
)
2,066
(1)
(1,379
)
(2)
(764
)
(3)
(688
)
(4)
Less: Net earnings attributable to
noncontrolling interests
5
3
-
-
-
-
Net (Loss) earnings Attributable to Eastman
Kodak Company
(123
)
(81
)
2,066
(1,379
)
(764
)
(688
)
Earnings and Dividends
(Loss) earnings from continuing operations
-
% of net sales from continuing operations
-
5.8
%
-
10.2
%
142.7
%
-
49.2
%
-
20.6
%
-
12.6
%
Net (loss) earnings
-
% return on average equity
-
25.9
%
-
12.7
%
70.6
%
-
45.8
%
-
44.6
%
-
124.0
%
Basic and diluted (loss) earnings per share
attributable to Eastman Kodak Company
common shareholders:
Continuing operations
(3.05
)
(2.04
)
8.08
(4.92
)
(2.75
)
(2.08
)
Discontinued operations
0.10
0.10
(0.50
)
(0.15
)
(0.09
)
(0.48
)
Total
(2.95
)
(1.94
)
7.58
(5.07
)
(2.84
)
(2.56
)
Cash dividends declared and paid
-
on common shares
-
-
-
-
-
-
-
per comon share
-
-
-
-
-
-
Weighted average common shares outstanding
at end of period
41.7
41.7
272.7
271.8
269.1
268.5
Shareholders at year end
4,860
1,511
N/A
48,656
49,760
51,802
Statement of Financial Position Data
Working capital
951
1,086
564
(806
)
(60
)
966
Property, plant and equipment, net
524
684
507
607
796
1,037
Total assets
2,556
3,200
3,037
4,321
4,676
6,226
Short-term borrowings and current portion of
long
-
term debt
5
4
681
699
152
50
Long
-
term debt, net of current portion
672
674
370
740
1,363
1,195
23