Kodak 2014 Annual Report Download - page 111
Download and view the complete annual report
Please find page 111 of the 2014 Kodak annual report below. You can navigate through the pages in the report by either clicking on the pages listed below, or by using the keyword search tool below to find specific information within the annual report.-
 1
1 -
2
-
3
-
4
-
5
-
6
-
7
-
8
-
9
-
10
-
11
-
12
-
13
-
14
-
15
-
16
-
17
-
18
-
19
-
20
-
21
-
22
-
23
-
24
-
25
-
26
-
27
-
28
-
29
-
30
-
31
-
32
-
33
-
34
-
35
-
36
-
37
-
38
-
39
-
40
-
41
-
42
-
43
-
44
-
45
-
46
-
47
-
48
-
49
-
50
-
51
-
52
-
53
-
54
-
55
-
56
-
57
-
58
-
59
-
60
-
61
-
62
-
63
-
64
-
65
-
66
-
67
-
68
-
69
-
70
-
71
-
72
-
73
-
74
-
75
-
76
-
77
-
78
-
79
-
80
-
81
-
82
-
83
-
84
-
85
-
86
-
87
-
88
-
89
-
90
-
91
-
92
-
93
-
94
-
95
-
96
-
97
-
98
-
99
-
100
-
 101
101 -
 102
102 -
 103
103 -
 104
104 -
 105
105 -
 106
106 -
 107
107 -
 108
108 -
 109
109 -
 110
110 -
 111
111 -
 112
112 -
 113
113 -
 114
114 -
 115
115 -
 116
116 -
 117
117 -
 118
118 -
 119
119 -
 120
120 -
 121
121 -
122
-
123
-
124
-
125
-
126
-
127
-
128
-
129
-
130
-
131
-
132
-
133
-
134
-
135
-
136
-
137
-
138
-
139
-
140
-
141
-
142
-
143
-
144
-
145
-
146
-
147
-
148
-
149
-
150
-
151
-
152
-
153
-
154
-
155
-
156
 |
 |

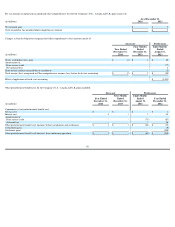
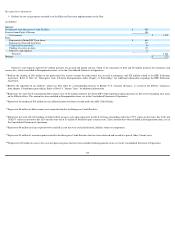
(in millions)
Successor
Predecessor
Capital additions from continuing
operations:
Year Ended
December 31,
2014
Four Months
Ended
December 31,
2013
Eight Months
Ended
August 31,
2013
Year Ended
December 31,
2012
Graphics, Entertainment and Commercial Films
$
22
$
13
$
10
$
14
Digital Printing and Enterprise
13
8
6
18
Sub-total
35
21
16
32
Other
8
-
2
1
Consolidated total
$
43
$
21
$
18
$
33
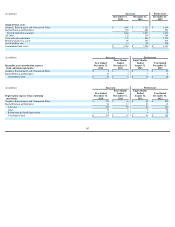
(in millions)
Successor
Predecessor
Net sales to external customers
attributed to
(1)
:
Year Ended
December 31,
2014
Four Months
Ended
December 31,
2013
Eight Months
Ended
August 31,
2013
Year Ended
December 31,
2012
The United States
$
737
$
238
$
515
$
852
Europe, Middle East and Africa
727
287
548
966
Asia Pacific
451
207
330
660
Canada and Latin America
187
75
149
241
Non U.S. countries total
1,365
569
1,027
1,867
Consolidated total
$
2,102
$
807
$
1,542
$
2,719
(1)
Sales are reported in the geographic area in which they originate. The Company’
s operations in Japan generated more than 10% of net sales in the year ended December
31, 2012, totaling $274 million. No other non-
U.S. country generated more than 10% of net sales in the year ended December 31, 2014, four months ended December 31,
2013, eight months ended August 31, 2013 or year ended December 31, 2012.
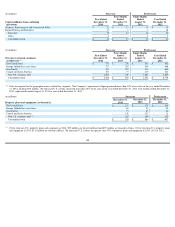
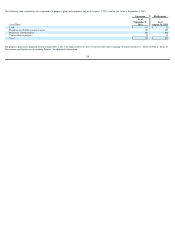
(in millions)
Successor
Predecessor
Property, plant and equipment, net located in:
December 31,
2014
December 31,
2013
December 31,
2012
The United States
$
271
$
378
$
395
Europe, Middle East and Africa
68
91
85
Asia Pacific
75
83
96
Canada and Latin America
110
132
31
Non U.S. countries total
(1)
253
306
212
Consolidated total
$
524
$
684
$
607
(1)
Of the total non U.S. property, plant and equipment in 2014, $95 million are located in Brazil and $59 million are located in China. Of the total non U.S. property, plant
and equipment in 2013, $113 million are located in Brazil. No other non U.S. country had greater than 10% of property, plant and equipment in 2014, 2013 or 2012.
108