Kodak 2014 Annual Report Download - page 97
Download and view the complete annual report
Please find page 97 of the 2014 Kodak annual report below. You can navigate through the pages in the report by either clicking on the pages listed below, or by using the keyword search tool below to find specific information within the annual report.-
 1
1 -
2
-
3
-
4
-
5
-
6
-
7
-
8
-
9
-
10
-
11
-
12
-
13
-
14
-
15
-
16
-
17
-
18
-
19
-
20
-
21
-
22
-
23
-
24
-
25
-
26
-
27
-
28
-
29
-
30
-
31
-
32
-
33
-
34
-
35
-
36
-
37
-
38
-
39
-
40
-
41
-
42
-
43
-
44
-
45
-
46
-
47
-
48
-
49
-
50
-
51
-
52
-
53
-
54
-
55
-
56
-
57
-
58
-
59
-
60
-
61
-
62
-
63
-
64
-
65
-
66
-
67
-
68
-
69
-
70
-
71
-
72
-
73
-
74
-
75
-
76
-
77
-
78
-
79
-
80
-
81
-
82
-
83
-
84
-
85
-
86
-
 87
87 -
 88
88 -
 89
89 -
 90
90 -
 91
91 -
 92
92 -
 93
93 -
 94
94 -
 95
95 -
 96
96 -
 97
97 -
 98
98 -
 99
99 -
 100
100 -
 101
101 -
 102
102 -
 103
103 -
 104
104 -
 105
105 -
 106
106 -
 107
107 -
108
-
109
-
110
-
111
-
112
-
113
-
114
-
115
-
116
-
117
-
118
-
119
-
120
-
121
-
122
-
123
-
124
-
125
-
126
-
127
-
128
-
129
-
130
-
131
-
132
-
133
-
134
-
135
-
136
-
137
-
138
-
139
-
140
-
141
-
142
-
143
-
144
-
145
-
146
-
147
-
148
-
149
-
150
-
151
-
152
-
153
-
154
-
155
-
156
 |
 |
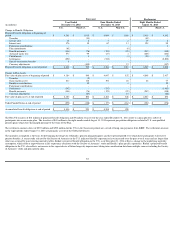
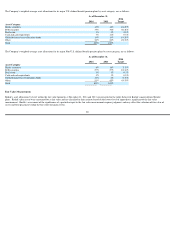
For all of Kodak’s major defined benefit pension plans, investment managers are selected that are expected to provide best-in-class asset management for their particular
asset class, and expected returns greater than those expected from existing salable assets, especially if this would maintain the aggregate volatility desired for each plan’s
portfolio. Investment managers are retained for the purpose of managing specific investment strategies within contractual investment guidelines. Certain investment
managers are authorized to invest in derivatives such as futures, swaps, and currency forward contracts. Investments in futures and swaps are used to obtain targeted
exposure to a particular asset, index or bond duration and only require a portion of the cash to gain exposure to the notional value of the underlying investment. The
remaining cash is available to be deployed and in some cases is invested in a diversified portfolio of various uncorrelated hedge fund strategies that provide added returns at
a lower level of risk. Of the investments shown in the major U.S. plans table above, 9% and 25% of the total pension assets as of December 31, 2014 reported in equity
securities and government bonds, respectively, and 10%, 10%, and 3% of the total pension assets as of December 31, 2013 reported in equity securities, government bonds,
and inflation-linked bonds, respectively, are reflective of the exposures gained from the use of derivatives, and are invested in a diversified portfolio of hedge funds using
equity, debt, commodity, and currency strategies.
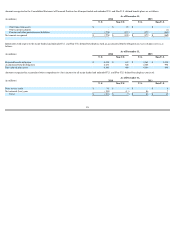
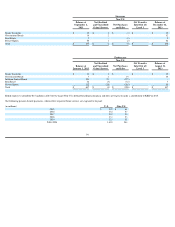
Of the investments shown in the major Non-U.S. plans table above, 1%, and 9% of the total pension assets as of December 31, 2014 reported in equity securities and
government bonds, respectively, and 1%, and 10% of the total pension assets as of December 31, 2013 reported in equity securities and government bonds, respectively, are
reflective of the exposures gained from the use of derivatives, and are invested in a diversified portfolio of hedge funds using equity, debt, commodity, and currency strategies.
Foreign currency contracts and swaps are used to partially hedge foreign currency risk. Additionally, Kodak’s major defined benefit pension plans invest in government bond
futures or local government bonds to partially hedge the liability risk of the plans.
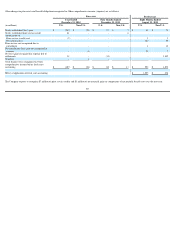
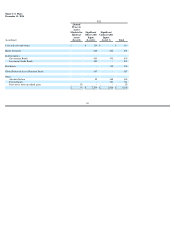
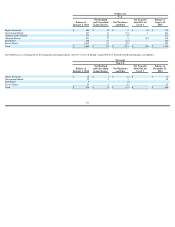
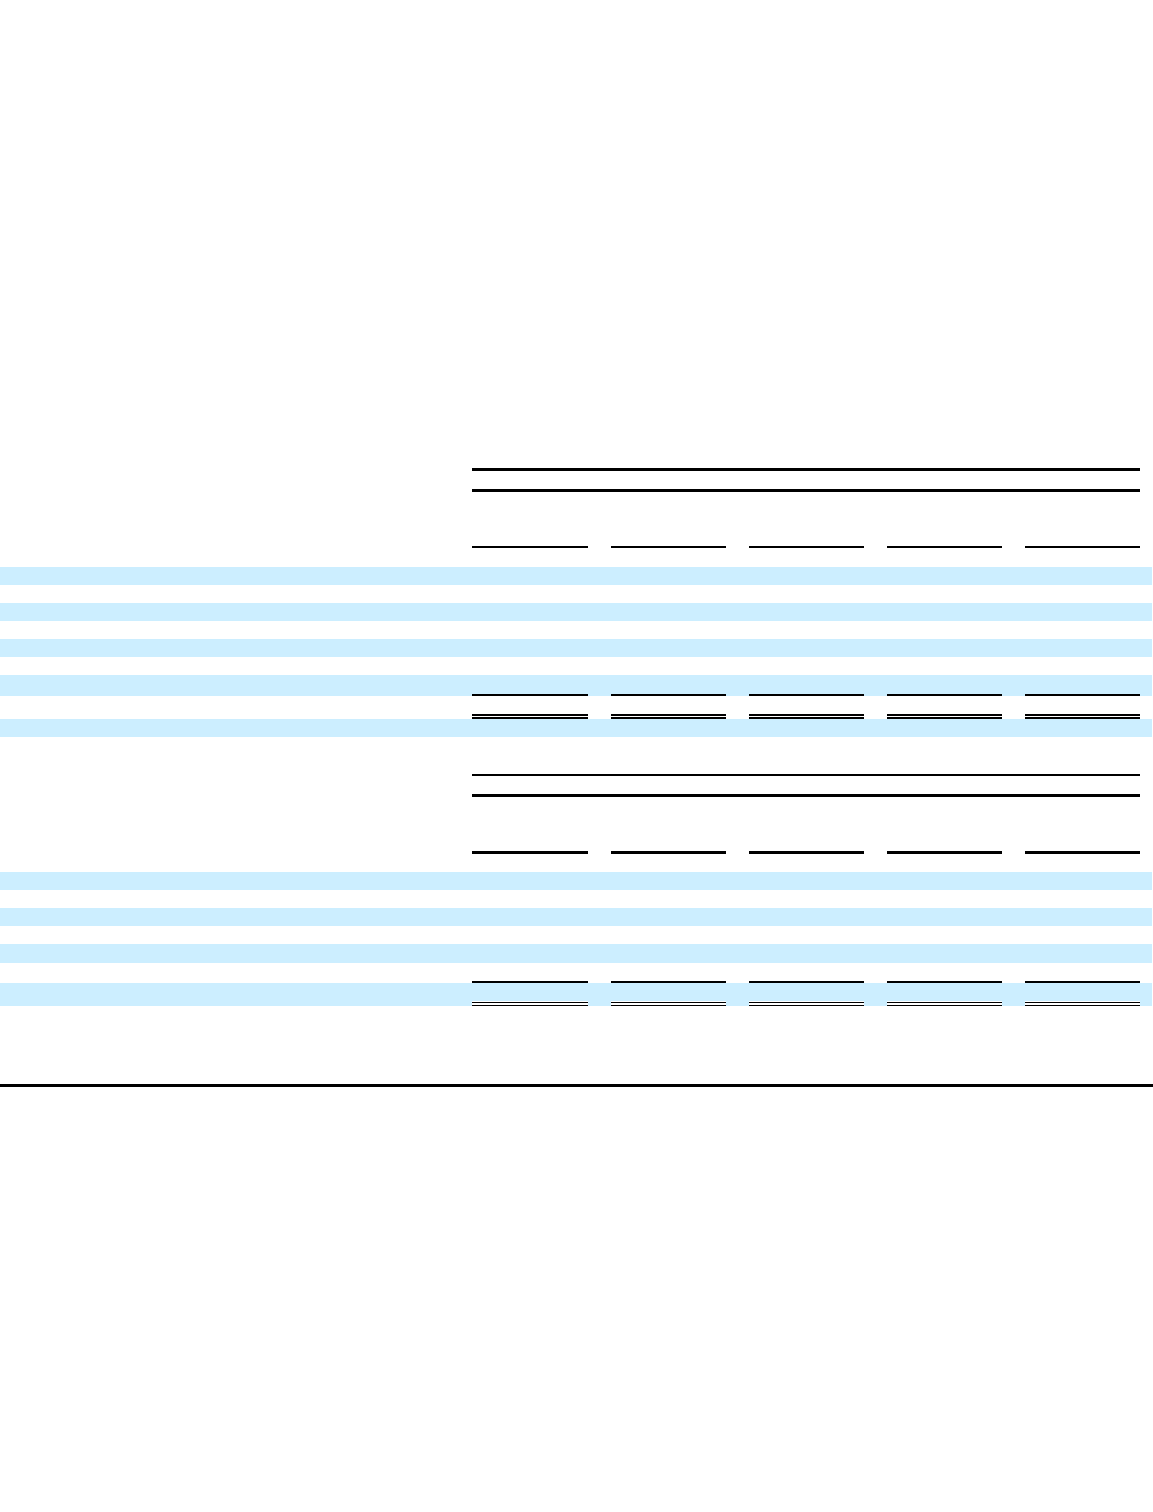
The following is a reconciliation of the beginning and ending balances of level 3 assets of Kodak’s major U.S. defined benefit pension plans:
(in millions)
Successor
U.S.
Balance at
January 1, 2014
Net Realized
and Unrealized
Gains/(Losses)
Net Purchases
and Sales
Net Transfer
Into/(Out of)
Level 3
Balance at
December 31,
2014
Equity Securities
$
183
$
22
$
18
$
-
$
223
Government Bonds
205
26
164
-
395
Inflation
-
Linked Bonds
105
(1
)
(104
)
-
-
Global High Yield & Emerging Market Debt
178
25
(203
)
-
-
Absolute Return
-
(8
)
293
83
368
Real Estate
200
22
(83
)
-
139
Private Equity
951
93
(263
)
-
781
Total
$
1,822
$
179
$
(178
)
$
83
$
1,906
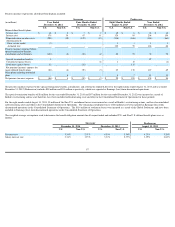
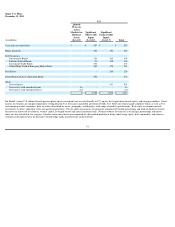
Successor
U.S.
Balance at
September 1,
2013
Net Realized
and Unrealized
Gains/(Losses)
Net Purchases
and Sales
Net Transfer
Into/(Out of)
Level 3
Balance at
December 31,
2013
Equity Securities
$
176
$
9
$
(2
)
$
-
$
183
Government Bonds
204
5
(4
)
-
205
Inflation
-
Linked Bonds
111
(4
)
(2
)
-
105
Global High Yield & Emerging Market Debt
140
38
-
-
178
Real Estate
204
6
(10
)
-
200
Private Equity
959
52
(60
)
-
951
Total
$
1,794
$
106
$
(78
)
$
-
$
1,822
94