Kodak 2014 Annual Report Download - page 45
Download and view the complete annual report
Please find page 45 of the 2014 Kodak annual report below. You can navigate through the pages in the report by either clicking on the pages listed below, or by using the keyword search tool below to find specific information within the annual report.-
 1
1 -
2
-
3
-
4
-
5
-
6
-
7
-
8
-
9
-
10
-
11
-
12
-
13
-
14
-
15
-
16
-
17
-
18
-
19
-
20
-
21
-
22
-
23
-
24
-
25
-
26
-
27
-
28
-
29
-
30
-
31
-
32
-
33
-
34
-
 35
35 -
 36
36 -
 37
37 -
 38
38 -
 39
39 -
 40
40 -
 41
41 -
 42
42 -
 43
43 -
 44
44 -
 45
45 -
 46
46 -
 47
47 -
 48
48 -
 49
49 -
 50
50 -
 51
51 -
 52
52 -
 53
53 -
 54
54 -
 55
55 -
56
-
57
-
58
-
59
-
60
-
61
-
62
-
63
-
64
-
65
-
66
-
67
-
68
-
69
-
70
-
71
-
72
-
73
-
74
-
75
-
76
-
77
-
78
-
79
-
80
-
81
-
82
-
83
-
84
-
85
-
86
-
87
-
88
-
89
-
90
-
91
-
92
-
93
-
94
-
95
-
96
-
97
-
98
-
99
-
100
-
101
-
102
-
103
-
104
-
105
-
106
-
107
-
108
-
109
-
110
-
111
-
112
-
113
-
114
-
115
-
116
-
117
-
118
-
119
-
120
-
121
-
122
-
123
-
124
-
125
-
126
-
127
-
128
-
129
-
130
-
131
-
132
-
133
-
134
-
135
-
136
-
137
-
138
-
139
-
140
-
141
-
142
-
143
-
144
-
145
-
146
-
147
-
148
-
149
-
150
-
151
-
152
-
153
-
154
-
155
-
156
 |
 |

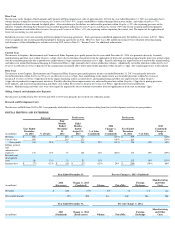
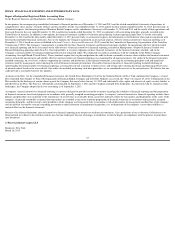
Off-Balance Sheet Arrangements
EKC guarantees obligations to third parties for some of its consolidated subsidiaries. The maximum amount guaranteed is $34 million and the outstanding amount for those
guarantees is $20 million.
Kodak issues indemnifications in certain instances when it sells businesses and real estate, and in the ordinary course of business with its customers, suppliers, service
providers and business partners. Further, the Company indemnifies its directors and officers who are, or were, serving at the Company's request in such
capacities. Historically, costs incurred to settle claims related to these indemnifications have not been material to Kodak’s financial position, results of operations or
cash flows. Additionally, the fair value of the indemnifications that Kodak issued during the year ended December 31, 2014 was not material to Kodak’s financial
position, results of operations or cash flows.
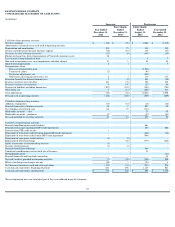
2013
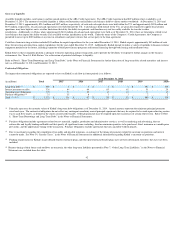
Cash Flow Activity
Sources and uses of cash at emergence (including divesture of the Personalized Imaging and Document Imaging businesses) follow:
Operating Activities
Net cash used in operating activities increased $378 million for the year ended December 31, 2013 as compared with the prior year due to emergence related cash outflows and
less cash being provided by working capital changes as compared to the prior year, partially offset by earnings improvement.
Investing Activities
Net cash provided by investing activities increased $708 million for the year ended December 31, 2013 as compared with the prior year, primarily due to the increase in
proceeds from sales of businesses/assets of $746 million. The sale of the digital imaging patent portfolio contributed approximately $530 million and the sale of the
Personalized Imaging and Document Imaging businesses contributed $290 million to investing activities. Partially offsetting these increases was the net funding of restricted
cash and investment accounts of $41 million.
Financing Activities
Net cash used in financing activities increased $874 million for the year ended December 31, 2013 as compared with the prior year due to the net pay
-down of debt in 2013 of
approximately $811 million compared with borrowing under the Original Senior DIP Credit Agreement in 2012. Partially offsetting the increased cash used in financing
activities were the proceeds from the Rights Offering of $406 million and $35 million of contingent cash received related to the sale of the Personalized Imaging and
Document Imaging businesses in 2013.
As of December 31,
Successor
Predecessor
(in millions)
2013
2012
Cash and cash equivalents
$
844
$
1,135
Sources:
Net Proceeds from Emergence Credit Facilities
$
664
Proceeds from divestiture
325
Proceeds from Rights Offerings
406
Total sources
$
1,395
Uses:
Repayment of Junior DIP Term Loans
$
844
Repayment of Second Lien Notes
375
Claims paid at emergence
94
Funding of escrow accounts
113
Other fees & expenses
16
Total uses
1,442
Net uses
$
(47
)
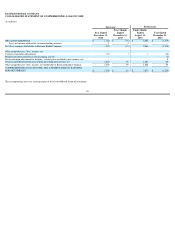
(in millions)
Successor
Predecessor
Predecessor
Four Months
Ended
December 31,
2013
Eight Months
Ended
August 31,
2013
Year Ended
December 31,
2012
Computed
Change vs 2012
(2013
Combined)
Cash flows from operating activities:
Net cash used in operating activities
$
(102
)
$
(565
)
$
(289
)
$
(378
)
Cash flows from investing activities:
Net cash provided by investing activities
81
679
52
708
Cash flows from financing activities:
Net cash (used in) provided by financing activities
(38
)
(328
)
508
(874
)
Effect of exchange rate changes on cash
5
(23
)
3
(21
)
Net (decrease) increase in cash and cash equivalents
$
(54
)
$
(237
)
$
274
$
(565
)
43