Kodak 2014 Annual Report Download - page 40
Download and view the complete annual report
Please find page 40 of the 2014 Kodak annual report below. You can navigate through the pages in the report by either clicking on the pages listed below, or by using the keyword search tool below to find specific information within the annual report.-
 1
1 -
2
-
3
-
4
-
5
-
6
-
7
-
8
-
9
-
10
-
11
-
12
-
13
-
14
-
15
-
16
-
17
-
18
-
19
-
20
-
21
-
22
-
23
-
24
-
25
-
26
-
27
-
28
-
29
-
 30
30 -
 31
31 -
 32
32 -
 33
33 -
 34
34 -
 35
35 -
 36
36 -
 37
37 -
 38
38 -
 39
39 -
 40
40 -
 41
41 -
 42
42 -
 43
43 -
 44
44 -
 45
45 -
 46
46 -
 47
47 -
 48
48 -
 49
49 -
 50
50 -
51
-
52
-
53
-
54
-
55
-
56
-
57
-
58
-
59
-
60
-
61
-
62
-
63
-
64
-
65
-
66
-
67
-
68
-
69
-
70
-
71
-
72
-
73
-
74
-
75
-
76
-
77
-
78
-
79
-
80
-
81
-
82
-
83
-
84
-
85
-
86
-
87
-
88
-
89
-
90
-
91
-
92
-
93
-
94
-
95
-
96
-
97
-
98
-
99
-
100
-
101
-
102
-
103
-
104
-
105
-
106
-
107
-
108
-
109
-
110
-
111
-
112
-
113
-
114
-
115
-
116
-
117
-
118
-
119
-
120
-
121
-
122
-
123
-
124
-
125
-
126
-
127
-
128
-
129
-
130
-
131
-
132
-
133
-
134
-
135
-
136
-
137
-
138
-
139
-
140
-
141
-
142
-
143
-
144
-
145
-
146
-
147
-
148
-
149
-
150
-
151
-
152
-
153
-
154
-
155
-
156
 |
 |

Prior Year
The decrease in the Graphics, Entertainment and Commercial Films Segment net sales of approximately 10% for the year ended December 31, 2013 was primarily due to
volume declines within Entertainment Imaging & Commercial Films (-9%), largely attributable to reduced demand from movie studios, and within Graphics (-7%),
largely attributable to lower demand for digital plates. Also contributing to the decline was unfavorable price/mix within Graphics (-2%) due to pricing pressures in the
industry. Partially offsetting these declines was favorable price/mix within Intellectual Property and Brand Licensing (+6%) due to non-recurring intellectual property
licensing agreements and within Entertainment Imaging and Commercial Films (+3%) due to pricing actions impacting the current year. The impact of the application of
fresh start accounting was not material.
Included in revenues were non-recurring intellectual property licensing agreements. Such agreements contributed approximately $40 million to revenues in 2013. There
were no significant non-recurring intellectual property licensing agreements in 2012. However, there was a $61 million licensing revenue reduction reflecting sharing,
with licensees, of the withholding tax refund received in 2012 (refer to Note 14, “Income Taxes” for additional information).
Gross Profit
Current Year
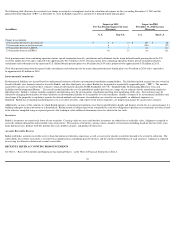
The increase in Graphics, Entertainment and Commercial Films Segment gross profit percent for the year ended December 31, 2014 was primarily driven by favorable
manufacturing and other costs within Graphics
(+5pp), due to the revaluation of inventory from the application of fresh start accounting impacting the prior year period (+2pp)
with the remainder primarily due to productivity improvements (+1pp) and lower aluminum cost (+1pp). Partially offsetting this improvement was unfavorable manufacturing
and other costs within Entertainment Imaging & Commercial Films (-3pp), primarily due to lower production volumes. Additionally, favorable price/mix within Intellectual
Property and Brand Licensing
(+2pp) due to the arrangements mentioned above offset unfavorable price/mix within Graphics (-2pp) due to pricing pressures in the industry.
Prior Year
The increase in the Graphics, Entertainment and Commercial Films Segment gross profit percent for the year ended December 31, 2013 was primarily driven by
favorable price/mix within Intellectual Property and Brand Licensing (+5pp). Also contributing to the improvement was favorable price/mix within Entertainment
Imaging & Commercial Films
(+2pp) driven by the impact of pricing actions as noted above, and manufacturing and other cost improvements within Graphics
(+4pp) due to productivity improvement initiatives. Partially offsetting these improvements was unfavorable price/mix within Graphics (-2pp) due to pricing pressures
in the industry, and increased manufacturing and others costs within Entertainment Imaging & Commercial Films (-2pp) driven by lower production
volumes. Manufacturing and other costs were also negatively impacted by the revaluation of inventory from the application of fresh start accounting (-2pp).
Selling, General and Administrative Expenses
The decreases in SG&A from 2013 to 2014 and 2012 to 2013 were primarily the result of cost reduction actions.
Research and Development Costs
The decrease in R&D from 2012 to 2013 was primarily attributable to cost reduction actions resulting from focused development activities on core products.
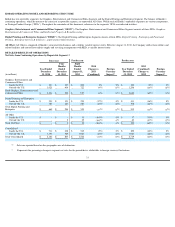
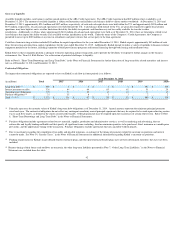
DIGITAL PRINTING AND ENTERPRISE
Successor
Predecessor
Predecessor
(in millions)
Year Ended
December
31, 2014
% of Sales
Four
Months
Ended
December
31,
2013
Eight
Months
Ended
August 31,
2013
% of Sales
(Combined)
2014
Change vs.
2013
(Combined)
Year Ended
December
31, 2012
% of Sales
2013
(Combined)
Change vs.
2012
Net sales
$
668
$
284
$
519
(17
%)
$
939
(14
%)
Cost of sales
504
243
373
(18
%)
813
(24
%)
Gross profit
164
25
%
41
146
23
%
(12
%)
126
13
%
48
%
Selling, general
and
administrative
expenses
153
23
%
67
128
24
%
(22
%)
274
29
%
(29
%)
Research and
development
costs
88
13
%
33
55
11
% -
132
14
%
(33
%)
Segment loss
$
(77
)
(12
%)
$
(59
)
$
(37
)
(12
%)
20
%
$
(280
)
(30
%)
66
%
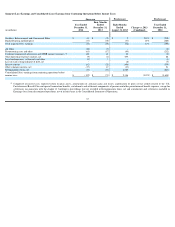
Year Ended December 31,
Percent Change vs. 2013 (Combined)
(in millions)
2014
(Successor)
Change vs. 2013
(Combined)
Volume
Price/Mix
Foreign
Exchange
Manufacturing
and Other
Costs
Net Sales
$
668
-
17
%
-
15
%
-
1
%
-
1
%
n/a
Gross profit margin
25
%
2pp
n/a
-
3pp
0pp
5pp
Year Ended December 31,
Percent Change vs. 2012
(in millions)
2013
(Combined)
Change vs. 2012
(Predecessor)
Volume
Price/Mix
Foreign
Exchange
Manufacturing
and Other
Costs