Kodak 2014 Annual Report Download - page 34
Download and view the complete annual report
Please find page 34 of the 2014 Kodak annual report below. You can navigate through the pages in the report by either clicking on the pages listed below, or by using the keyword search tool below to find specific information within the annual report.-
 1
1 -
2
-
3
-
4
-
5
-
6
-
7
-
8
-
9
-
10
-
11
-
12
-
13
-
14
-
15
-
16
-
17
-
18
-
19
-
20
-
21
-
22
-
23
-
 24
24 -
 25
25 -
 26
26 -
 27
27 -
 28
28 -
 29
29 -
 30
30 -
 31
31 -
 32
32 -
 33
33 -
 34
34 -
 35
35 -
 36
36 -
 37
37 -
 38
38 -
 39
39 -
 40
40 -
 41
41 -
 42
42 -
 43
43 -
 44
44 -
45
-
46
-
47
-
48
-
49
-
50
-
51
-
52
-
53
-
54
-
55
-
56
-
57
-
58
-
59
-
60
-
61
-
62
-
63
-
64
-
65
-
66
-
67
-
68
-
69
-
70
-
71
-
72
-
73
-
74
-
75
-
76
-
77
-
78
-
79
-
80
-
81
-
82
-
83
-
84
-
85
-
86
-
87
-
88
-
89
-
90
-
91
-
92
-
93
-
94
-
95
-
96
-
97
-
98
-
99
-
100
-
101
-
102
-
103
-
104
-
105
-
106
-
107
-
108
-
109
-
110
-
111
-
112
-
113
-
114
-
115
-
116
-
117
-
118
-
119
-
120
-
121
-
122
-
123
-
124
-
125
-
126
-
127
-
128
-
129
-
130
-
131
-
132
-
133
-
134
-
135
-
136
-
137
-
138
-
139
-
140
-
141
-
142
-
143
-
144
-
145
-
146
-
147
-
148
-
149
-
150
-
151
-
152
-
153
-
154
-
155
-
156
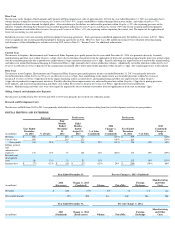
 |
 |

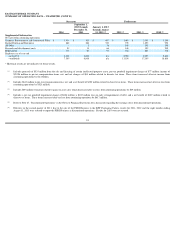
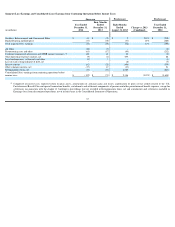
RESULTS OF OPERATIONS
CONSOLIDATED
Successor
Predecessor
Predecessor
(in millions)
Year Ended
December
31, 2014
% of Sales
Four
Months
Ended
December
31, 2013
Eight
Months
Ended
August 31,
2013
% of Sales
(Combined)
% Change
vs. 2013
(Combined)
Year Ended
December
31, 2012
% of Sales
% Change
vs. 2012
(2013
Combined)
Net sales
$
2,102
$
807
$
1,542
(11
%)
$
2,719
(14
%)
Cost of sales
1,646
687
1,174
2,426
Gross profit
456
22
%
120
368
21
%
(7
%)
293
11
%
67
%
Selling, general
and administrative
expenses
310
15
%
114
297
17
%
(25
%)
637
23
%
(35
%)
Research and
development costs
94
4
%
33
66
4
%
(5
%)
168
6
%
(41
%)
Restructuring
costs and other
59
3
%
17
43
3
%
(2
%)
215
8
%
(72
%)
Other operating
expense (income),
net
9
(0
%)
2
(495
)
21
%
(102
%)
(85
)
3
%
480
%
(Loss) earnings
from continuing
operations before
interest expense,
loss on early
extinguishment of
debt, net, other
(charges) income,
net, reorganization
items, net and
income taxes
(16
)
1
%
(46
)
457
17
%
(104
%)
(642
)
(24
%)
(164
%)
Interest expense
62
3
%
22
106
5
%
(52
%)
139
5
%
(8
%)
Loss on early
extinguishment of
debt, net
-
-
8
0
%
7
0
%
Other (charges)
income, net
(21
)
1
%
10
(13
)
0
%
600
%
21
1
%
(114
%)
Reorganization
items, net
13
1
%
16
(2,026
)
86
%
(101
%)
843
31
%
(338
%)
(Loss) earnings
from continuing
operations before
income taxes
(112
)
(5
%)
(74
)
2,356
97
%
(105
%)
(1,610
)
(59
%)
242
%
Provision (benefit)
for income taxes
10
0
%
8
155
7
%
(94
%)
(273
)
(10
%)
(160
%)
(Loss) earnings
from continuing
operations
(122
)
(6
%)
(82
)
2,201
90
%
(106
%)
(1,337
)
(49
%)
258
%
Earnings (loss)
from discontinued
operations, net of
income taxes
4
0
%
4
(135
)
(6
%)
(103
%)
(42
)
(2
%)
212
%
NET (LOSS)
EARNINGS
(118
)
(6
%)
(78
)
2,066
85
%
(106
%)
(1,379
)
(51
%)
244
%
Less: Net income
attributable to
noncontrolling
interests
5
0
%
3
-
0
%
-
-
-
NET (LOSS)
EARNINGS
ATTRIBUTABLE
TO EASTMAN
KODAK
COMPANY
$
(123
)
(6
%)
$
(81
)
$
2,066
85
%
(106
%)
$
(1,379
)
(51
%)
244
%
33