Kia 2007 Annual Report Download - page 83
Download and view the complete annual report
Please find page 83 of the 2007 Kia annual report below. You can navigate through the pages in the report by either clicking on the pages listed below, or by using the keyword search tool below to find specific information within the annual report.-
 1
1 -
2
-
3
-
4
-
5
-
6
-
7
-
8
-
9
-
10
-
11
-
12
-
13
-
14
-
15
-
16
-
17
-
18
-
19
-
20
-
21
-
22
-
23
-
24
-
25
-
26
-
27
-
28
-
29
-
30
-
31
-
32
-
33
-
34
-
35
-
36
-
37
-
38
-
39
-
40
-
41
-
42
-
43
-
44
-
45
-
46
-
47
-
48
-
49
-
50
-
51
-
52
-
53
-
54
-
55
-
56
-
57
-
58
-
59
-
60
-
61
-
62
-
63
-
64
-
65
-
66
-
67
-
68
-
69
-
70
-
71
-
72
-
 73
73 -
 74
74 -
 75
75 -
 76
76 -
 77
77 -
 78
78 -
 79
79 -
 80
80 -
 81
81 -
 82
82 -
 83
83 -
 84
84 -
 85
85 -
 86
86 -
 87
87 -
 88
88 -
 89
89 -
 90
90 -
 91
91 -
 92
92 -
 93
93 -
94
-
95
-
96
-
97
-
98
-
99
-
100
-
101
-
102
-
103
-
104
-
105
-
106
-
107
-
108
-
109
-
110
-
111
-
112
 |
 |

083_
Kia Motors Annual Report 2007
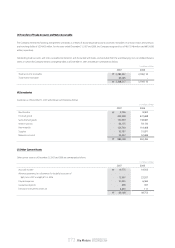
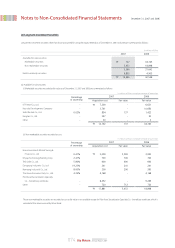
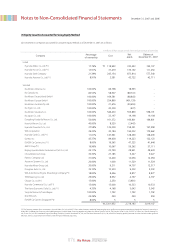
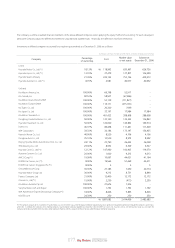
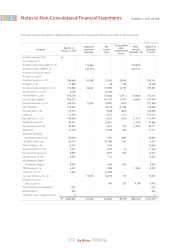
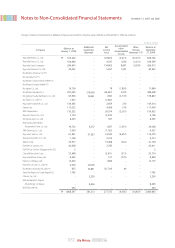
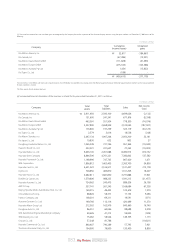
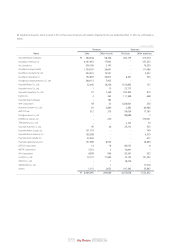
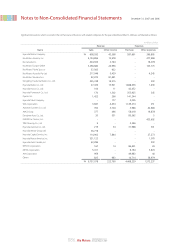
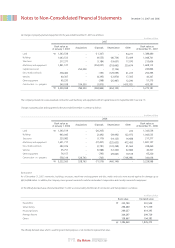
(e) Summarized financial information of the investees as of and for the year ended December 31, 2007 is as follows:
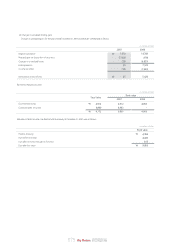
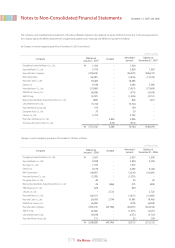
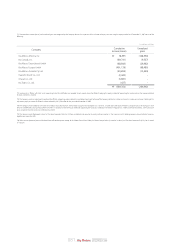
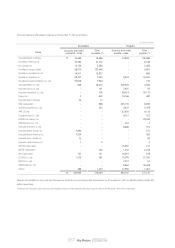
(*1) The cumulative income (loss) and unrealized gains not recognized by the Company due to the suspension of the valuation of equity securities using the equity method as of December 31, 2006 consist of the
following :
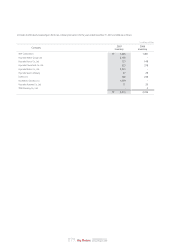
(*2) Investments in small affiliates with total assets amounting to less than ₩70 billion are recorded at cost, except where the effect of applying the equity method of accounting for investments on the non-consolidated
financial statements is material.
(*3) Others consist of cash dividends declared.
Company
52,917
(67,386)
(111,828)
(275,165)
1,036
(189)
(400,615)
₩
₩
Cumulative
Income (losses)
Unrealized
gains
(184,967)
(13,531)
(41,490)
(123,368)
(13,822)
-
(377,178)
Kia Motors America, Inc.
Kia Canada, Inc.
Kia Motors Deutschland GmbH
Kia Motors Europe GmbH
Kia Motors Australia Pty Ltd.
Kia Tigers Co., Ltd.
In millions of Won
2,611,693
151,600
463,091
2,257,800
176,600
2,579
2,467,134
19,830
1,065,349
323,031
6,626,100
8,846,506
1,168,996
1,896,812
4,621,523
728,650
2,682,611
1,579,806
724,962
557,741
169,515
88,826
108,201
169,766
212,003
86,551
90,626
75,062
57,248
860,607
194,900
2,593,100
241,341
551,934
2,658,939
197,259
3,016
1,907,244
632
731,746
331,637
2,451,686
4,761,321
747,743
1,403,405
3,516,917
465,870
1,681,850
988,233
245,475
261,245
49,423
58,377
69,311
112,116
162,979
60,046
41,312
58,524
81,788
790,389
79,000
4,699,026
677,976
778,500
3,515,045
323,119
18,538
2,050,200
803
951,964
27,362
8,490,912
7,382,842
867,020
3,365,700
1,121,407
1,101,205
3,731,888
1,591,213
889,036
1,169,684
122,679
17,152
16,591
420,069
845,660
88,688
59,005
149,755
-
57,793
120,400
(3,132)
(8,398)
(74,076)
(187,937)
(20,125)
(248)
32,141
27
(19,040)
(19,005)
810,132
537,582
1,471
54,800
213,178
16,207
17,901
(21,657)
36,108
67,338
1,579
5,066
(871)
11,370
16,740
2,078
(939)
1,173
(19,821)
7,921
8,800
₩
Sales
Total
liabilities
Total
assets
Company Net income
(loss)
Kia Motors America, Inc.
Kia Canada, Inc.
Kia Motors Deutschland GmbH
Kia Motors Europe GmbH
Kia Motors Australia Pty Ltd.
Kia Tigers Co., Ltd.
Kia Motors Slovakia s.r.o.
Kia Japan Co., Ltd.
Dongfeng Yueda Kia Motors Co., Ltd.
Haevichi Resort Co., Ltd.
Hyundai Mobis Co., Ltd.
Hyundai Steel Company
Hyundai Powertech Co., Ltd.
WIA Corporation
Hyundai Card Co., Ltd.
Dymos Inc.
Hyundai Hysco Co., Ltd.
EUKOR Car Carriers, Inc.
Hyundai Autonet Co., Ltd.
AMCO Corp.
Beijing Hyundai Mobis Automotive Parts Co., Ltd.
China Millennium Corp.
Partecs Company, Ltd.
Autoever Systems Co., Ltd.
Hyundai-Motor Group Ltd.
Donghee Auto Co., Ltd.
WIA Automotive Engine (Shandong) Company
TRW Steering Co., Ltd.
Chasan Co., Ltd.
Hyundai Commercial Co., Ltd.
The Korea Economic Daily Co., Ltd.
In millions of Won