Kia 2007 Annual Report Download - page 56
Download and view the complete annual report
Please find page 56 of the 2007 Kia annual report below. You can navigate through the pages in the report by either clicking on the pages listed below, or by using the keyword search tool below to find specific information within the annual report.-
 1
1 -
2
-
3
-
4
-
5
-
6
-
7
-
8
-
9
-
10
-
11
-
12
-
13
-
14
-
15
-
16
-
17
-
18
-
19
-
20
-
21
-
22
-
23
-
24
-
25
-
26
-
27
-
28
-
29
-
30
-
31
-
32
-
33
-
34
-
35
-
36
-
37
-
38
-
39
-
40
-
41
-
42
-
43
-
44
-
45
-
 46
46 -
 47
47 -
 48
48 -
 49
49 -
 50
50 -
 51
51 -
 52
52 -
 53
53 -
 54
54 -
 55
55 -
 56
56 -
 57
57 -
 58
58 -
 59
59 -
 60
60 -
 61
61 -
 62
62 -
 63
63 -
 64
64 -
 65
65 -
 66
66 -
67
-
68
-
69
-
70
-
71
-
72
-
73
-
74
-
75
-
76
-
77
-
78
-
79
-
80
-
81
-
82
-
83
-
84
-
85
-
86
-
87
-
88
-
89
-
90
-
91
-
92
-
93
-
94
-
95
-
96
-
97
-
98
-
99
-
100
-
101
-
102
-
103
-
104
-
105
-
106
-
107
-
108
-
109
-
110
-
111
-
112
 |
 |

056_
Kia Motors Annual Report 2007
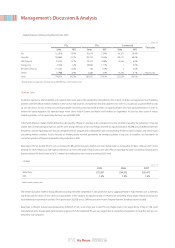
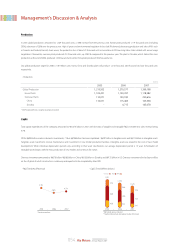
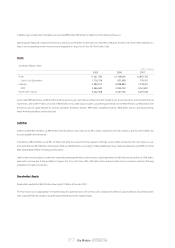
・F/X Rate (USD/KRW)
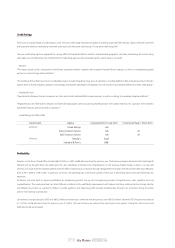
COGS and SG&A
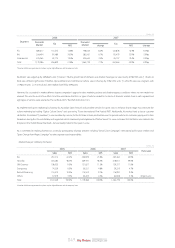
The COGS-to-revenue ratio was 85.2% - a decline of 0.4% point year on year. We could reap the result as we improved the cost structure and effectiveness
according to TCI (Technical Cost Innovation) activities, despite rising fixed cost burden caused by decreasing sales volume and revenue.
SG&A to revenue ratio recorded 15.1%, maintaining the same level with the previous year in spite of increasing fixed cost burden caused by revenue decrease. That
was because we tightened ordinary budget and lowered overseas marketing expense owing to reduction in export price.
・COGS (KRW in billions, % of Revenue)
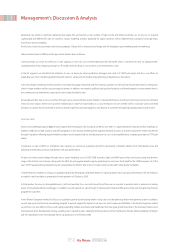
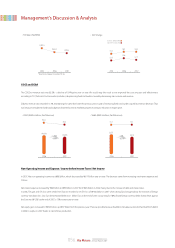
Non-Operating Income and Expense / Income before Income Taxes / Net Income
In 2007, Net non-operating income was ₩80 billion, which decreased by ₩119 billion year on year. The decrease came from increasing net interest expense and
F/X loss.
Net interest expense increased by ₩65 billion to ₩90 billion in 2007 from ₩25 billion in 2006, mainly due to the increase of debt and interest rates.
In 2006, F/X gain and F/X loss were similar level. But we recorded a net F/X loss of ₩166 billion in 2007 when strong Euro brought about the increase of foreign
currency translation loss. Our Euro denominated debt was 1 billion Euro at the end of 2007, accounting for 78% of total foreign currency debt. Korean Won against
the Euro was ₩1,381 at the end of 2007, a 13% increase year on year.
Net equity gains increased to ₩325 billion, up ₩47 billion from the previous year. That was possible because Kia Motors Slovakia was transformed itself from deficit
in 2006 to surplus in 2007 thanks to start of mass production.
Management’s Discussion & Analysis
・ASP Change
* Based on the company's transaction F/X rate
1,022.5
952.9 929.4
2005 2006 2007
15.5 16.5 16.5
12.3
13.6 12.7
2005 2006 2007
Domestic (Million KRW)
Export (Thousand US$)
・SG&A (KRW in billions, % of Revenue)
2006 2007
85.6
85.2
14,928 13,590
-1,338
-9.0%
2006 2007
15.1 15.1
2,637
2,414
-223
-8.5%