Kia 2007 Annual Report Download - page 57
Download and view the complete annual report
Please find page 57 of the 2007 Kia annual report below. You can navigate through the pages in the report by either clicking on the pages listed below, or by using the keyword search tool below to find specific information within the annual report.-
 1
1 -
2
-
3
-
4
-
5
-
6
-
7
-
8
-
9
-
10
-
11
-
12
-
13
-
14
-
15
-
16
-
17
-
18
-
19
-
20
-
21
-
22
-
23
-
24
-
25
-
26
-
27
-
28
-
29
-
30
-
31
-
32
-
33
-
34
-
35
-
36
-
37
-
38
-
39
-
40
-
41
-
42
-
43
-
44
-
45
-
46
-
 47
47 -
 48
48 -
 49
49 -
 50
50 -
 51
51 -
 52
52 -
 53
53 -
 54
54 -
 55
55 -
 56
56 -
 57
57 -
 58
58 -
 59
59 -
 60
60 -
 61
61 -
 62
62 -
 63
63 -
 64
64 -
 65
65 -
 66
66 -
 67
67 -
68
-
69
-
70
-
71
-
72
-
73
-
74
-
75
-
76
-
77
-
78
-
79
-
80
-
81
-
82
-
83
-
84
-
85
-
86
-
87
-
88
-
89
-
90
-
91
-
92
-
93
-
94
-
95
-
96
-
97
-
98
-
99
-
100
-
101
-
102
-
103
-
104
-
105
-
106
-
107
-
108
-
109
-
110
-
111
-
112
 |
 |

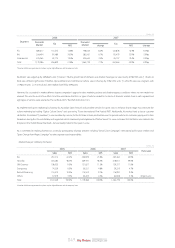
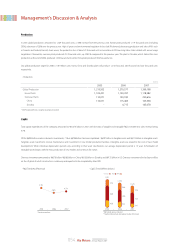
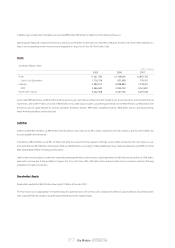
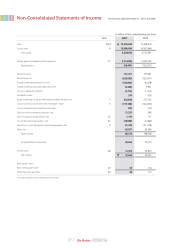
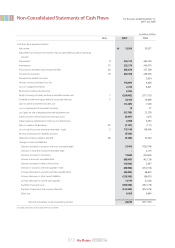
In addition, gain on disposition of tangible assets recorded ₩65 billion (₩16 billion in 2006) due to the disposal of idle asset.
Operating profit improved compared to the previous year, but income before income taxes was reduced by 0.2% point to 0.2% in 2007 from 0.4% in 2006 due to a
drop in net non-operating income. Net income also dropped by 0.1 % point to 0.1% in 2007 from 0.2% in 2006.
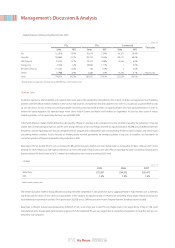
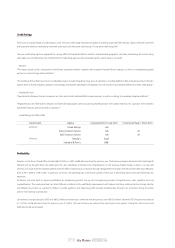
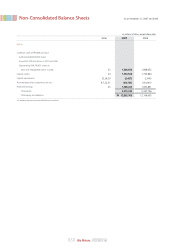
Assets
・Summary of Balance Sheet
Assets totaled ₩12,854 billion, up ₩747 billion from the previous year. Cash balances at the end of 2007 including cash & cash equivalents and short-term financial
instruments, came to ₩777 billion, an incline of ₩145 billion versus 2006. Equity securities, using the equity method, rose to ₩3,019 billion, up ₩536 billion from
the previous year by capital injection for overseas subsidiaries (Kia Motors Slovakia : ₩95 billion, Dongfeng Yueda Kia : ₩28 billion, and etc.) and equity earnings
mainly from Hyundai Mobis and Hyundai Steel.
Liabilities
Liabilities totaled ₩7,778 billion, up ₩919 billion from the previous year. Debt rose by ₩1.2 trillion compared to the end of previous year but other liabilities like
accounts payable-other decreased.
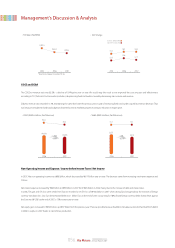
Total debt was ₩4,162 billion, up by ₩1,222 billion (including the increase from the evaluation of foreign currency debt) compared to the end of previous year.
Short-term debt was ₩1,508 billion and long-term debt was ₩2,654 billion, accounting for 36% and 64% respectively. Corporate debentures took 49% out of total
debt, totaling ₩2,024 billion (including current portion).
Debt has been increasing due to weaker-than-expected operating performance and continuous capital expenditure for R&D and overseas facilities. By 2008, debt is
expected to increase due to the possibility of negative FCF (Free Cash Flow). After 2009, debt will be reduced steadily due to investment reduction following
completion of US plant construction.
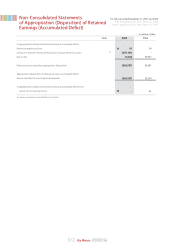
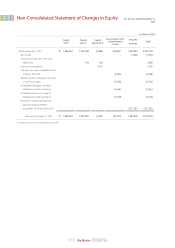
Shareholder’s Equity
Shareholder’s equity fell to ₩5,075 billion, down by ₩173 billion at the end of 2007.
The main reason was an appropriation of retained earings for capital injection to the overseas sales subsidiaries (Kia Motors Europe, Kia Motors Deutschland) which
were suspended from the valuation using the equity method due to their negative equity.
057_
Kia Motors Annual Report 2007
12,106,605
631,608
6,858,849
2,940,150
5,247,756
2006
11,241,785
1,116,724
5,989,417
2,046,040
5,252,368
2005 2007
12,853,763
776,911
7,778,421
4,161,801
5,075,342
Assets
Cash & Cash Equivalents
Liabilities
Debt
Shareholder’s Equity
(KRW in millions)