Kia 2007 Annual Report Download - page 61
Download and view the complete annual report
Please find page 61 of the 2007 Kia annual report below. You can navigate through the pages in the report by either clicking on the pages listed below, or by using the keyword search tool below to find specific information within the annual report.-
 1
1 -
2
-
3
-
4
-
5
-
6
-
7
-
8
-
9
-
10
-
11
-
12
-
13
-
14
-
15
-
16
-
17
-
18
-
19
-
20
-
21
-
22
-
23
-
24
-
25
-
26
-
27
-
28
-
29
-
30
-
31
-
32
-
33
-
34
-
35
-
36
-
37
-
38
-
39
-
40
-
41
-
42
-
43
-
44
-
45
-
46
-
47
-
48
-
49
-
50
-
 51
51 -
 52
52 -
 53
53 -
 54
54 -
 55
55 -
 56
56 -
 57
57 -
 58
58 -
 59
59 -
 60
60 -
 61
61 -
 62
62 -
 63
63 -
 64
64 -
 65
65 -
 66
66 -
 67
67 -
 68
68 -
 69
69 -
 70
70 -
 71
71 -
72
-
73
-
74
-
75
-
76
-
77
-
78
-
79
-
80
-
81
-
82
-
83
-
84
-
85
-
86
-
87
-
88
-
89
-
90
-
91
-
92
-
93
-
94
-
95
-
96
-
97
-
98
-
99
-
100
-
101
-
102
-
103
-
104
-
105
-
106
-
107
-
108
-
109
-
110
-
111
-
112
 |
 |

061_
Kia Motors Annual Report 2007
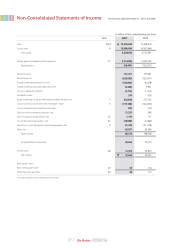
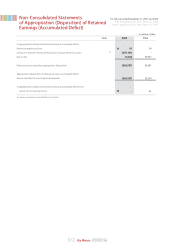
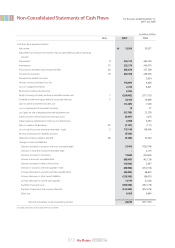
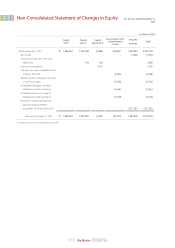
For the years ended December 31, 2007 and 2006
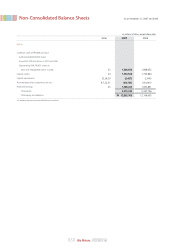
Non-Consolidated Statements of Income
In millions of Won, except earnings per share
2007 2006
Sales
Cost of sales
Gross profit
Selling, general and administrative expenses
Operating loss
Interest income
Interest expense
Foreign currency translation loss, net
Foreign currency transaction gain (loss), net
Loss on scrapped inventories
Dividend income
Equity in earnings of equity method accounted investees, net
Loss on sale of accounts and notes receivable - trade
Loss on impairment of investment securities
Gain on sale of investment securities, net
Gain on valuation of derivatives, net
Loss on derivative transactions, net
Gain (loss) on sale of property, plant and equipment, net
Other, net
Other income
Income before income taxes
Income taxes
Net income
Earnings per share
Basic earnings per share
Diluted earnings per share
15,948,542
13,589,960
2,358,582
2,413,986
(55,404)
131,471
(220,633)
(154,890)
(1,360)
(1,776)
574
324,842
(117,148)
(15)
11,221
1,141
(10,692)
51,760
65,877
80,372
24,968
11,405
13,563
39
39
17,439,910
14,927,949
2,511,961
2,637,252
(125,291)
127,981
(152,641)
(6,428)
7,931
(1,767)
536
277,755
(124,096)
(57)
345
111
(2,484)
(21,278)
92,596
198,504
73,213
33,876
39,337
114
113
Note
8,34
8
27
7
3
22
22
9
28
29
29
₩
₩
See accompanying notes to non-consolidated financial statements.