Kia 2007 Annual Report Download - page 103
Download and view the complete annual report
Please find page 103 of the 2007 Kia annual report below. You can navigate through the pages in the report by either clicking on the pages listed below, or by using the keyword search tool below to find specific information within the annual report.-
 1
1 -
2
-
3
-
4
-
5
-
6
-
7
-
8
-
9
-
10
-
11
-
12
-
13
-
14
-
15
-
16
-
17
-
18
-
19
-
20
-
21
-
22
-
23
-
24
-
25
-
26
-
27
-
28
-
29
-
30
-
31
-
32
-
33
-
34
-
35
-
36
-
37
-
38
-
39
-
40
-
41
-
42
-
43
-
44
-
45
-
46
-
47
-
48
-
49
-
50
-
51
-
52
-
53
-
54
-
55
-
56
-
57
-
58
-
59
-
60
-
61
-
62
-
63
-
64
-
65
-
66
-
67
-
68
-
69
-
70
-
71
-
72
-
73
-
74
-
75
-
76
-
77
-
78
-
79
-
80
-
81
-
82
-
83
-
84
-
85
-
86
-
87
-
88
-
89
-
90
-
91
-
92
-
 93
93 -
 94
94 -
 95
95 -
 96
96 -
 97
97 -
 98
98 -
 99
99 -
 100
100 -
 101
101 -
 102
102 -
 103
103 -
 104
104 -
 105
105 -
 106
106 -
 107
107 -
 108
108 -
 109
109 -
 110
110 -
 111
111 -
 112
112
 |
 |

103_
Kia Motors Annual Report 2007
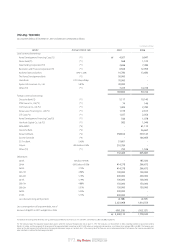
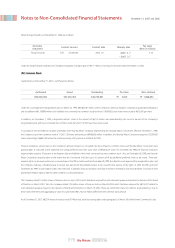
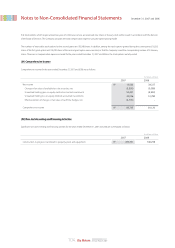
(29) Earnings Per Share
Earnings per share of common stock for the years ended December 31, 2007 and 2006 are calculated as follows:
(a) Basic earnings per share are calculated by dividing net income by the weighted-average number of shares of common stock outstanding.
(b) Diluted earnings per share are calculated by dividing net income, as adjusted assuming all potentially dilutive stock options have been exercised, by the
weighted-average number of common and common equivalent shares outstanding.
For the purpose of calculating the weighted-average number of common equivalent shares outstanding, the Company assumed that ordinary shares were issued
upon exercise of the dilutive stock options at the average market price of the ordinary shares during the period. The difference between the number of ordinary
shares issued and the number of ordinary shares that would have been issued at the average market price (₩12,185 and ₩18,335 for the year ended 2007 and
2006, respectively) of ordinary shares during the period is considered as an issue of ordinary shares for no consideration.
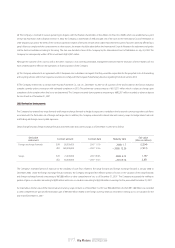
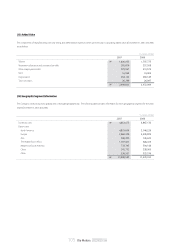
(30) Stock Options
The Company granted stock options to its executive officers and directors in accordance with the stock option plan approved by the Board of Directors. The details
of the stock options granted are as follows:
13,562,942,696
346,635,383
39
₩
₩
2007 2006
39,336,697,185
346,522,839
114
Net income
Weighted-average number of common shares Outstanding
Earnings per share
In Won, except number of shares
13,562,942,696
-
13,562,942,696
346,635,383
75,227
346,710,610
39
₩
₩
2007 2006
39,336,697,185
-
39,336,697,185
346,522,839
186,786
346,709,625
113
Net income
Stock option compensation
Weighted-average number of common shares outstanding
Weighted-average number of common equivalent shares outstanding*
Weighted-average number of common and common equivalent shares outstanding
Diluted earnings per share in Won
Granted
Cancelled
Exercised
Remaining
Grant date
Vesting period
Exercise period
Exercise price
In Won, except number of shares
*2007:[105,048-(105,048×8,200÷12,185)]×(365/365)+[16,256-(16,256×5,500÷12,185)+ 105,030-(105,030×8,200÷12,185)]×( 344/365)
2006:[16,256-(16,256×5,500÷18,335)+210,078-(210,078×8,200÷18,335)]×(365/365)+ [6,667- (6,667×5,500 ÷18,335) + 105,019 - (105,019×8,200 ÷18,335)]×(345/365)
3,735
(125)
(3,610)
-
950,000
(31,655)
(918,345)
-
₩
₩
₩
₩
Compensation expensesNumber of shares Compensation expenses
695,000
(379,903)
(210,049)
105,048
2,974
(1,614)
(910)
450
Number of shares
1st Grant 2nd Grant
Won (millions, except shares)
March 17,2000
2 years from grant date
2003.3.18 ~ 2008.3.17
₩5,500
February 20,2003
2 years from grant date
2006.2.20 ~ 2011.2.19
₩8,200