IBM 1999 Annual Report Download - page 95
Download and view the complete annual report
Please find page 95 of the 1999 IBM annual report below. You can navigate through the pages in the report by either clicking on the pages listed below, or by using the keyword search tool below to find specific information within the annual report.-
 1
1 -
2
-
3
-
4
-
5
-
6
-
7
-
8
-
9
-
10
-
11
-
12
-
13
-
14
-
15
-
16
-
17
-
18
-
19
-
20
-
21
-
22
-
23
-
24
-
25
-
26
-
27
-
28
-
29
-
30
-
31
-
32
-
33
-
34
-
35
-
36
-
37
-
38
-
39
-
40
-
41
-
42
-
43
-
44
-
45
-
46
-
47
-
48
-
49
-
50
-
51
-
52
-
53
-
54
-
55
-
56
-
57
-
58
-
59
-
60
-
61
-
62
-
63
-
64
-
65
-
66
-
67
-
68
-
69
-
70
-
71
-
72
-
73
-
74
-
75
-
76
-
77
-
78
-
79
-
80
-
81
-
82
-
83
-
84
-
 85
85 -
 86
86 -
 87
87 -
 88
88 -
 89
89 -
 90
90 -
 91
91 -
 92
92 -
 93
93 -
 94
94 -
 95
95 -
 96
96 -
 97
97 -
 98
98 -
 99
99 -
 100
100
 |
 |

notes to consolidated financial statements
International Business Machines Corporation
and Subsidiary Companies
93
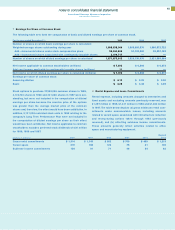
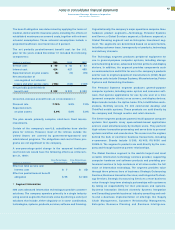
Reconciliations to IBM as Reported
(Dollars in millions) 1999 1998 1997
ASSETS:
Total reportable segments $«59,308 $«60,106 $«54,242
Elimination of internal
transactions (5,776) (7,519) (6,287)
Unallocated amounts:
Cash and marketable
securities 4,563 4,295 6,062
Notes and accounts
receivable 7,004 7,715 7,441
Deferred tax assets 5,428 5,376 4,746
Plant, other property
and equipment 6,146 7,706 7,564
Pension assets 5,636 4,836 3,828
Other 5,186 3,585 3,903
Total IBM Consolidated $«87,495 $«86,100 $«81,499
Revenue by Classes of Similar Products or Services
For the Personal Systems, Server, Software and Global Financing
segments, the segment data on page 91 represents the reve-
nue contributions from the products that are contained in the
segments and that are basically similar in nature. The table
below provides external revenue for similar classes of products
within the Technology and Global Services segments. OEM
hardware comprises primarily revenue from the sale of HDD
storage files and semiconductors. Storage comprises exter-
nally attached direct access storage devices and tape storage
devices. Other technology comprises advanced function printers
and networking devices.
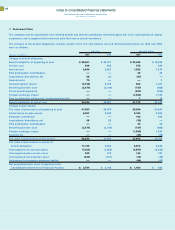
Consolidated
(Dollars in millions) 1999 1998 1997
Technology:
OEM $«7,800 $«6,756 $«5,560
Storage 2,389 2,439 2,644
Other technology 2,408 2,695 2,879
Global Services:
Services 27,035 23,730 19,534
Maintenance 5,137 5,186 5,632
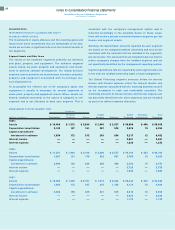
Major Customers
No single customer represents 10 percent or more of the com-
pany’s total revenue.
Geographic Information Revenue*Long-lived Assets**
(Dollars in millions) 1999 1998 1997 1999 1998 1997
United States $«37,171 $«35,303 $«32,663 $«19,309 $«18,450 $«17,802
Japan 10,411 8,567 9,765 4,710 4,310 3,635
Other countries 39,966 37,797 36,080 10,259 12,343 11,621
Total $«87,548 $«81,667 $«78,508 $«34,278 $«35,103 $«33,058
*Revenues are attributed to countries based on location of customer.
**Includes all non-current assets except non-current financial instruments and deferred tax assets.