IBM 1999 Annual Report Download - page 61
Download and view the complete annual report
Please find page 61 of the 1999 IBM annual report below. You can navigate through the pages in the report by either clicking on the pages listed below, or by using the keyword search tool below to find specific information within the annual report.-
 1
1 -
2
-
3
-
4
-
5
-
6
-
7
-
8
-
9
-
10
-
11
-
12
-
13
-
14
-
15
-
16
-
17
-
18
-
19
-
20
-
21
-
22
-
23
-
24
-
25
-
26
-
27
-
28
-
29
-
30
-
31
-
32
-
33
-
34
-
35
-
36
-
37
-
38
-
39
-
40
-
41
-
42
-
43
-
44
-
45
-
46
-
47
-
48
-
49
-
50
-
 51
51 -
 52
52 -
 53
53 -
 54
54 -
 55
55 -
 56
56 -
 57
57 -
 58
58 -
 59
59 -
 60
60 -
 61
61 -
 62
62 -
 63
63 -
 64
64 -
 65
65 -
 66
66 -
 67
67 -
 68
68 -
 69
69 -
 70
70 -
 71
71 -
72
-
73
-
74
-
75
-
76
-
77
-
78
-
79
-
80
-
81
-
82
-
83
-
84
-
85
-
86
-
87
-
88
-
89
-
90
-
91
-
92
-
93
-
94
-
95
-
96
-
97
-
98
-
99
-
100
 |
 |

management discussion
International Business Machines Corporation
and Subsidiary Companies
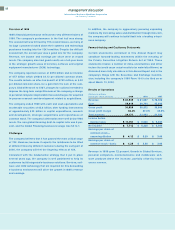
In December 1993, the company entered into a $10 billion
committed global credit facility to enhance the liquidity of funds.
This facility was amended in February 1997, and extended to
February 2002. As of December 31, 1999, $8,562 million was
unused and available.
The company managed assets of $273 million and $864 million
at December 31, 1999 and 1998, respectively, from the securiti-
zation of loans, leases and trade receivables. For additional
information, see note I, “Sale and Securitization of Receivables,”
on page 74.
The major rating agencies have continued their review of the
company’s financial condition. None of the agencies announced
a change in rating in 1999. Standard and Poor’s rates the com-
pany and its rated subsidiaries’ senior long-term debt as A+, the
commercial paper as A-1 and IBM’s preferred stock as A.
Moody’s Investors Service rates the senior long-term debt of
the company and its rated subsidiaries as A1, the commercial
paper as Prime-1, and the company’s preferred stock as “a1.”
Fitch Investors Service rates the company and its rated sub-
sidiaries’ senior long-term debt as AA-, commercial paper as
F-1+, and preferred stock as A+.
Duff & Phelps rates the company and its rated subsidiaries’
senior long-term debt as A+, commercial paper as Duff 1, and
the company’s preferred stock as A.
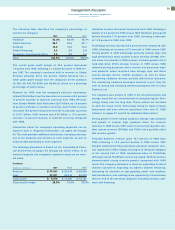
Cash Flows
The company’s cash flows from operating, investing and financ-
ing activities, as reflected in the Consolidated Statement of
Cash Flows on page 68, are summarized in the following table:
(Dollars in millions) 1999 1998 1997
Net cash provided from
(used in):
Operating activities $«10,111 $«««9,273 $«««8,865
Investing activities (1,669) (6,131) (6,155)
Financing activities (8,625) (4,993) (3,090)
Effect of exchange rate
changes on cash and
cash equivalents (149) 120 (201)
Net change in cash and
cash equivalents $«««««(332) $««(1,731) $«««÷(581)
Working Capital
(Dollars in millions)
At December 31: 1999 1998
Current assets $«43,155 $«42,360
Current liabilities 39,578 36,827
Working capital $÷«3,577 $«««5,533
Current ratio 1.09:1 1.15:1
Current assets increased $795 million, driven primarily by
increases of $837 million in accounts receivable, $227 million in
prepaid expenses and other current assets and $63 million in
cash and cash equivalents and marketable securities, offset by
a decrease of $332 million in inventories. The increase in
accounts receivable is due to strong global financing activity in
the software and services businesses across all geographies.
The increase in prepaid expenses and other current assets is
due to increases in deferred tax assets from year-end 1998. The
increase in cash and cash equivalents and marketable securi-
ties resulted primarily from cash generated from operations
and the net proceeds from the sale of the company’s Global
Network, offset by stock repurchases, capital expenditures and
strategic acquisitions.
The company ended 1999 with inventories of $4,868 million, the
lowest level since 1983, due to continued focus on inventory
management process improvements, notably in Personal
Systems. These improvements increased the company’s
inventory turnover to 5.9 in 1999 from 5.3 in 1998.
Current liabilities increased $2,751 million from year-end 1998
with increases of $1,667 million in taxes payable, $325 million
in short-term debt and $759 million in other current liabilities.
The increase in other current liabilities resulted from increases
in accounts payable ($148 million), compensation and benefits
($310 million), and deferred income ($414 million), and a
$113 million decrease in other accrued expenses and liabilities.
The increase in taxes payable primarily reflects improvements
in the company’s results associated with the sale of the com-
pany’s Global Network to AT&T. Short-term debt increased to
support the growth of global financing assets. The increase in
other current liabilities was primarily related to deferred
income, mainly advanced billings for software.
59