IBM 1999 Annual Report Download - page 8
Download and view the complete annual report
Please find page 8 of the 1999 IBM annual report below. You can navigate through the pages in the report by either clicking on the pages listed below, or by using the keyword search tool below to find specific information within the annual report.-
 1
1 -
 2
2 -
 3
3 -
 4
4 -
 5
5 -
 6
6 -
 7
7 -
 8
8 -
 9
9 -
 10
10 -
 11
11 -
 12
12 -
 13
13 -
 14
14 -
 15
15 -
 16
16 -
 17
17 -
 18
18 -
 19
19 -
20
-
21
-
22
-
23
-
24
-
25
-
26
-
27
-
28
-
29
-
30
-
31
-
32
-
33
-
34
-
35
-
36
-
37
-
38
-
39
-
40
-
41
-
42
-
43
-
44
-
45
-
46
-
47
-
48
-
49
-
50
-
51
-
52
-
53
-
54
-
55
-
56
-
57
-
58
-
59
-
60
-
61
-
62
-
63
-
64
-
65
-
66
-
67
-
68
-
69
-
70
-
71
-
72
-
73
-
74
-
75
-
76
-
77
-
78
-
79
-
80
-
81
-
82
-
83
-
84
-
85
-
86
-
87
-
88
-
89
-
90
-
91
-
92
-
93
-
94
-
95
-
96
-
97
-
98
-
99
-
100
 |
 |

transforming IBM into a leading e-business – and
not just in e-commerce sales, which I mentioned
earlier. In providing e-care for customers, we
handled 42 million self-service transactions in 1999,
avoiding some $750 million in support costs. We
delivered 25 percent of our internal training via
distributed learning, which has not only saved us
more than $200 million, but made it far easier and
faster for our people to educate themselves.
Through e-procurement, we bought about
$13 billion in goods and services over the Web,
saving at least $270 million. And our intranet,
which we believe is the largest and most heavily
trafficked in the world, has emerged as a vital
business platform and knowledge-sharing medium
for IBMers. It is quickly becoming IBM’s digital
nervous system.
[3] Shape the new face of IBM. What will “IBM”
mean to customers, potential customers and
employees, and the public at large in the years
ahead? Our brand used to be touched and our
company experienced primarily through our
products. But going forward, a smaller percentage
of our customers will buy an item with “IBM”
stamped on it. Instead, when they experience the
benefits of our innovative technology, much of it
will be inside other companies’ branded products,
or at work behind the scenes in the computing
infrastructure of the Net.
Even more important, they’ll experience IBM in
the person of another human being. Sometime
within the next five years, more than half of our
revenues and workforce will come from services.
This will mean that, very soon, revered IBM brand
attributes like quality, reliability and innovation will
primarily be descriptors of IBM people – their
knowledge, ideas and behavior – just as today they
describe IBM ThinkPads, servers and software.
We are very proud of what we accomplished
through the 1990s in reanimating the IBM brand.
Going forward, as the nature of our business
changes, we will create new ways to make “IBM”
relevant, compelling and exciting to people. And since
so much of the IBM experience will be shaped by our
people, I believe one of the most important tasks
will be building the training, development, reward
and knowledge management systems that support
the IBM workforce. In other words, the strategic
connection between our culture and our brand will
be even more important – and more visible.
What’s Next? Last year I told you about three
trends that were shaping the immediate future of
information technology:
>the Internet was creating not just new
businesses, but new business models;
>competitive advantage in the I/T industry was
moving from creating technology to helping
customers use it; and
>with the rise of the networked world, the PC
era was over.
There was some clucking about my PC era
statement by the usual suspects, but amid the ups
and downs of 1999, all three trends were confirmed
and underscored in the marketplace.
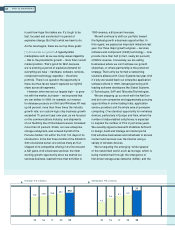
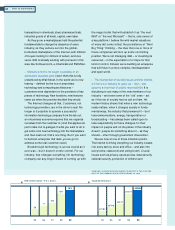
’95 ’96 ’97 ’98 ’99
dividends —[ $ per share
’95 ’96 ’97 ’98 ’99
ADJUSTED TO REFLECT A TWO-FOR-ONE SPLIT
OF THE COMMON STOCK EFFECTIVE MAY 10, 1999
06 letter to shareholders
capital investments —[ $ in billions
6.8
5.9
4.7
6.5 6.0
.25
.33
.39 .43
.47