IBM 1999 Annual Report Download - page 94
Download and view the complete annual report
Please find page 94 of the 1999 IBM annual report below. You can navigate through the pages in the report by either clicking on the pages listed below, or by using the keyword search tool below to find specific information within the annual report.-
 1
1 -
2
-
3
-
4
-
5
-
6
-
7
-
8
-
9
-
10
-
11
-
12
-
13
-
14
-
15
-
16
-
17
-
18
-
19
-
20
-
21
-
22
-
23
-
24
-
25
-
26
-
27
-
28
-
29
-
30
-
31
-
32
-
33
-
34
-
35
-
36
-
37
-
38
-
39
-
40
-
41
-
42
-
43
-
44
-
45
-
46
-
47
-
48
-
49
-
50
-
51
-
52
-
53
-
54
-
55
-
56
-
57
-
58
-
59
-
60
-
61
-
62
-
63
-
64
-
65
-
66
-
67
-
68
-
69
-
70
-
71
-
72
-
73
-
74
-
75
-
76
-
77
-
78
-
79
-
80
-
81
-
82
-
83
-
 84
84 -
 85
85 -
 86
86 -
 87
87 -
 88
88 -
 89
89 -
 90
90 -
 91
91 -
 92
92 -
 93
93 -
 94
94 -
 95
95 -
 96
96 -
 97
97 -
 98
98 -
 99
99 -
 100
100
 |
 |

notes to consolidated financial statements
International Business Machines Corporation
and Subsidiary Companies
Immaterial Items
INVESTMENT IN EQUITY ALLIANCES AND EQUITY
ALLIANCES GAINS/ LOSSES
The investments in equity alliances and the resulting gains and
losses from these investments that are attributable to the seg-
ments do not have a significant effect on the financial results of
the segments.
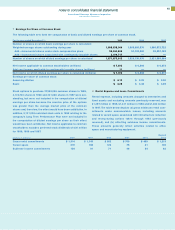
Segment Assets and Other Items
The assets of the hardware segments primarily are inventory
and plant, property and equipment. The software segment
assets mainly are plant, property and equipment, and invest-
ment in deferred software development. The Global Services
segment assets primarily are maintenance inventory and plant,
property and equipment associated with its strategic out-
sourcing business.
To accomplish the efficient use of the company’s space and
equipment, it usually is necessary for several segments to
share plant, property and equipment assets. Where assets are
shared, landlord ownership of the assets is assigned to one
segment and is not allocated to each user segment. This is
consistent with the company’s management system and is
reflected accordingly in the schedule below. In those cases,
there will not be a precise correlation between segment pre-tax
income and segment assets.
Similarly, the depreciation amounts reported by each segment
are based on the assigned landlord ownership and may not be
consistent with the amounts that are included in the segments’
pre-tax income. The amounts that are included in pre-tax income
reflect occupancy charges from the landlord segment and are
not specifically identified by the management reporting system.
Capital expenditures that are reported by each segment also are
in line with the landlord ownership basis of asset assignment.
The Global Financing segment amounts below for interest
income and interest expense reflect the interest income and
interest expense associated with the financing business as well
as the investment in cash and marketable securities. The
remaining amounts of interest income and interest expense are
not discretely identified to the other segments, but are included
as part of an indirect expense allocation.
92
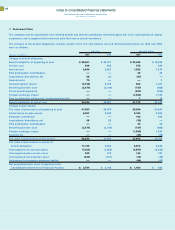
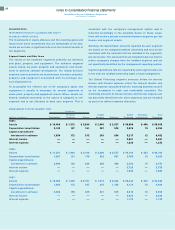
MANAGEMENT SYSTEM SEGMENT VIEW Hardware
Personal Global Global Enterprise Total
(Dollars in millions) Technology Systems Server Services Software Financing Investments Segments
1999:
Assets «$«10,409 $«1,372 $«2,846 $«2,060 $«2,527 $«39,686 $«408 $«59,308
Depreciation/ amortization 2,142 127 191 367 576 2,976 15 6,394
Capital expenditures/
investment in software 1,834 172 312 249 656 3,217 12 6,452
Interest income —————2,961—2,961
Interest expense —————1,232—1,232
1998:
Assets «$«11,251 $«1,464 $«2,106 $«2,236 $«2,577 $«40,109 $«363 $«60,106
Depreciation/ amortization 1,207 121 178 322 681 2,768 15 5,292
Capital expenditures/
investment in software 2,044 156 288 358 424 3,438 19 6,727
Interest income —————2,725—2,725
Interest expense —————1,252—1,252
1997 :
Assets «$«10,060 $«1,629 $«2,191 $«1,914 $«2,642 $«35,444 $«362 $«54,242
Depreciation/ amortization 1,092 112 167 315 1,132 2,170 10 4,998
Capital expenditures/
investment in software 2,028 195 235 361 515 3,615 16 6,965
Interest income —————2,639—2,639
Interest expense —————1,175—1,175